
Reason to trust
How Our News is Made
Strict editorial policy that focuses on accuracy, relevance, and impartiality
Ad discliamer
Morbi pretium leo et nisl aliquam mollis. Quisque arcu lorem, ultricies quis pellentesque nec, ullamcorper eu odio.
Key Highlights
- Ripple price is under a lot of pressure as it moved below the $0.7000 support against the US dollar.
- This week’s highlighted monster contracting triangle pattern with support near $0.7500 was broken on the hourly chart of the XRP/USD pair (data source from Kraken).
- The pair is currently trading above the $0.6000 level, but it remains at a risk of more losses.
Ripple price fell sharply against the US Dollar and Bitcoin. XRP/USD could extend declines in the near term as long as it is below the $0.7000 level.
Ripple Price Resistance
Buyers failed to initiate an upside move above $0.8200 in Ripple price against the US Dollar. As a result, there was a downside move and the price dropped below a major support at $0.7700. More importantly, this week’s highlighted monster contracting triangle pattern with support near $0.7500 was broken on the hourly chart of the XRP/USD pair.
The price even broke the last swing low of $0.7400 and the $0.7000 support. It is now trading well below the $0.7000 level and the 100 hourly simple moving average. The recent low formed was $0.6246 and it seems like the price may extend the current decline. An initial hurdle on the upside is around the 23.6% Fib retracement level of the last decline from the $0.7900 high to $0.6246 low. However, the most important resistance is near $0.7000, which was a support earlier. The same level is also the 50% Fib retracement level of the last decline from the $0.7900 high to $0.6246 low.
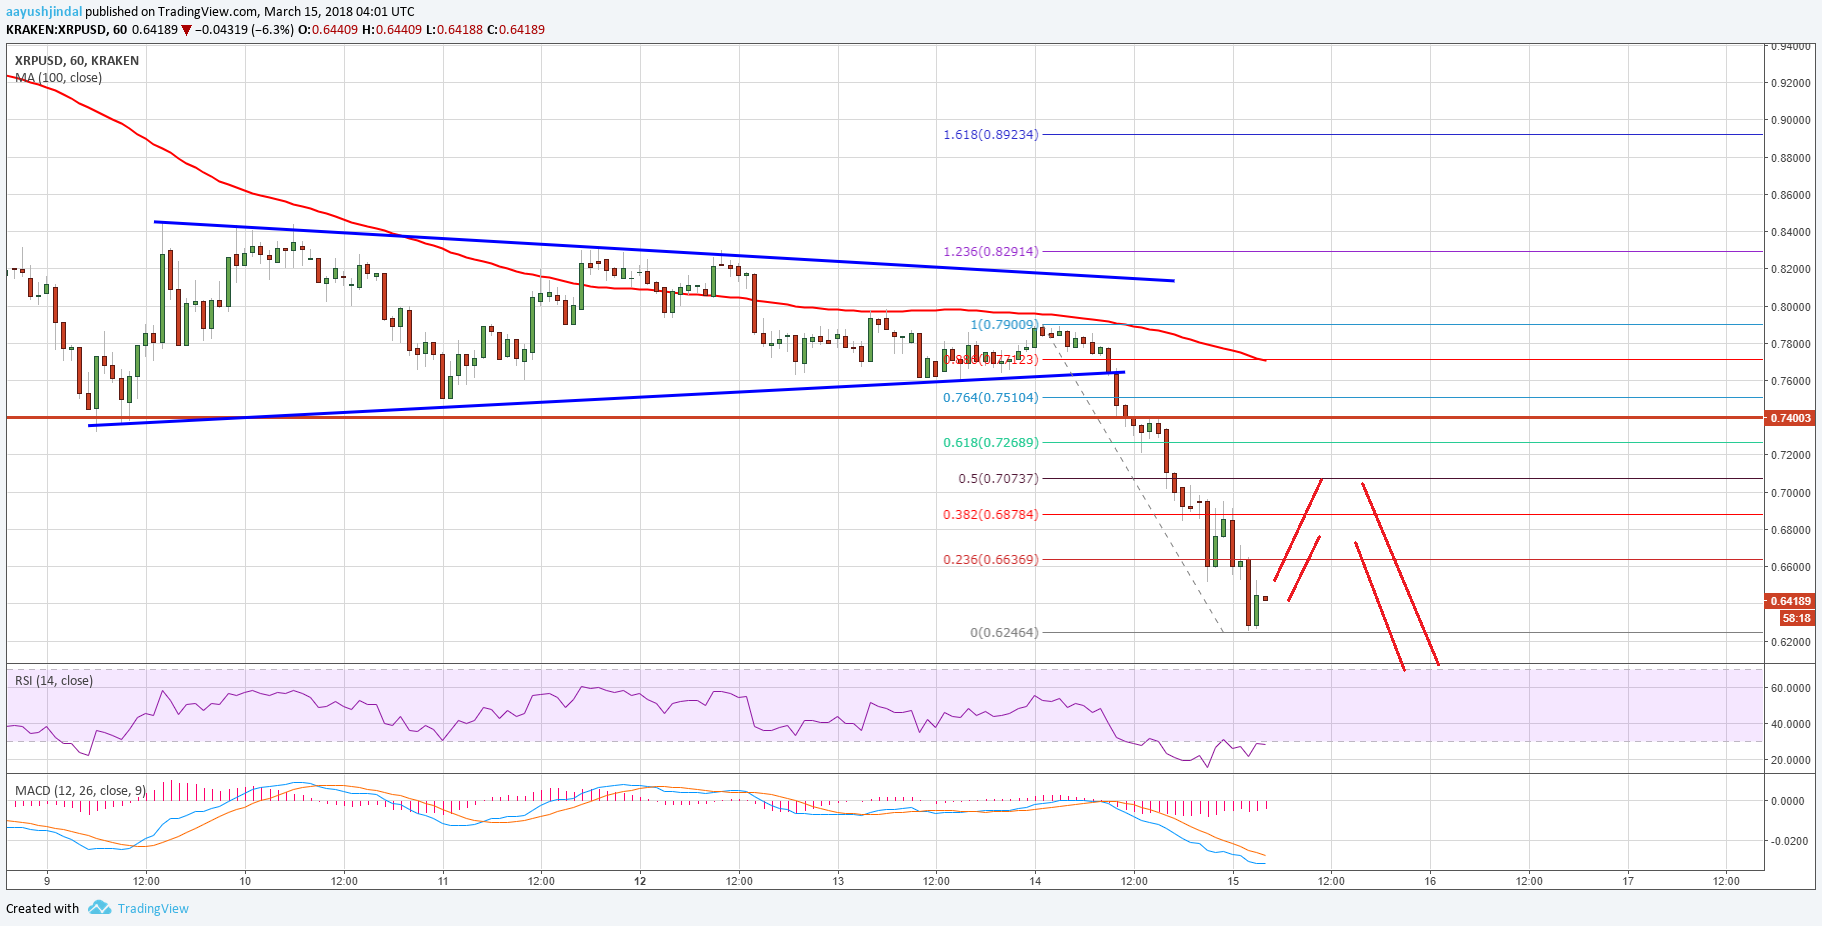
On the downside, the recent low of $0.6246 could be breached for a test of $0.6000. Below $0.6000, there are chances of XRP price moving towards the $0.5000 level.
Looking at the technical indicators:
Hourly MACD – The MACD for XRP/USD is now in the bearish zone.
Hourly RSI (Relative Strength Index) – The RSI for XRP/USD is consolidating near the oversold levels.
Major Support Level – $0.6000
Major Resistance Level – $0.7000
Charts courtesy – Trading View


