
Reason to trust
How Our News is Made
Strict editorial policy that focuses on accuracy, relevance, and impartiality
Ad discliamer
Morbi pretium leo et nisl aliquam mollis. Quisque arcu lorem, ultricies quis pellentesque nec, ullamcorper eu odio.
Key Highlights
- Ripple price started a major upside move from the $0.8850 swing low against the US dollar.
- There was a break above a key bearish trend line with resistance at $0.9300 on the hourly chart of the XRP/USD pair (data source from Kraken).
- The pair traded above the $1.000 level before starting a downside correction.
Ripple price traded above key resistance levels against the US Dollar and Bitcoin. XRP/USD is now trading in a bullish zone above the $0.9400 support.
Ripple Price Trend
After a brief consolidation around the $0.9000 level, Ripple price formed a base against the US Dollar. The price started a nice upside move from the $0.8850 swing low and moved above the $0.9200 resistance level. There was also a break above the $0.9400 resistance and a close above the 100 hourly simple moving average. These are positive signs and the price traded above the $1.000 level before starting a downside correction.
More importantly, there was a break above a key bearish trend line with resistance at $0.9300 on the hourly chart of the XRP/USD pair. Later, the pair corrected below the 23.6% Fib retracement level of the last wave from the $0.8858 low to $1.0318 high. However, the $0.9700 level is acting as a support. Furthermore, the 50% Fib retracement level of the last wave from the $0.8858 low to $1.0318 high is at $0.9588 to act a support. Therefore, it seems like there are many supports on the downside near the $0.9500 and $0.9400 levels.
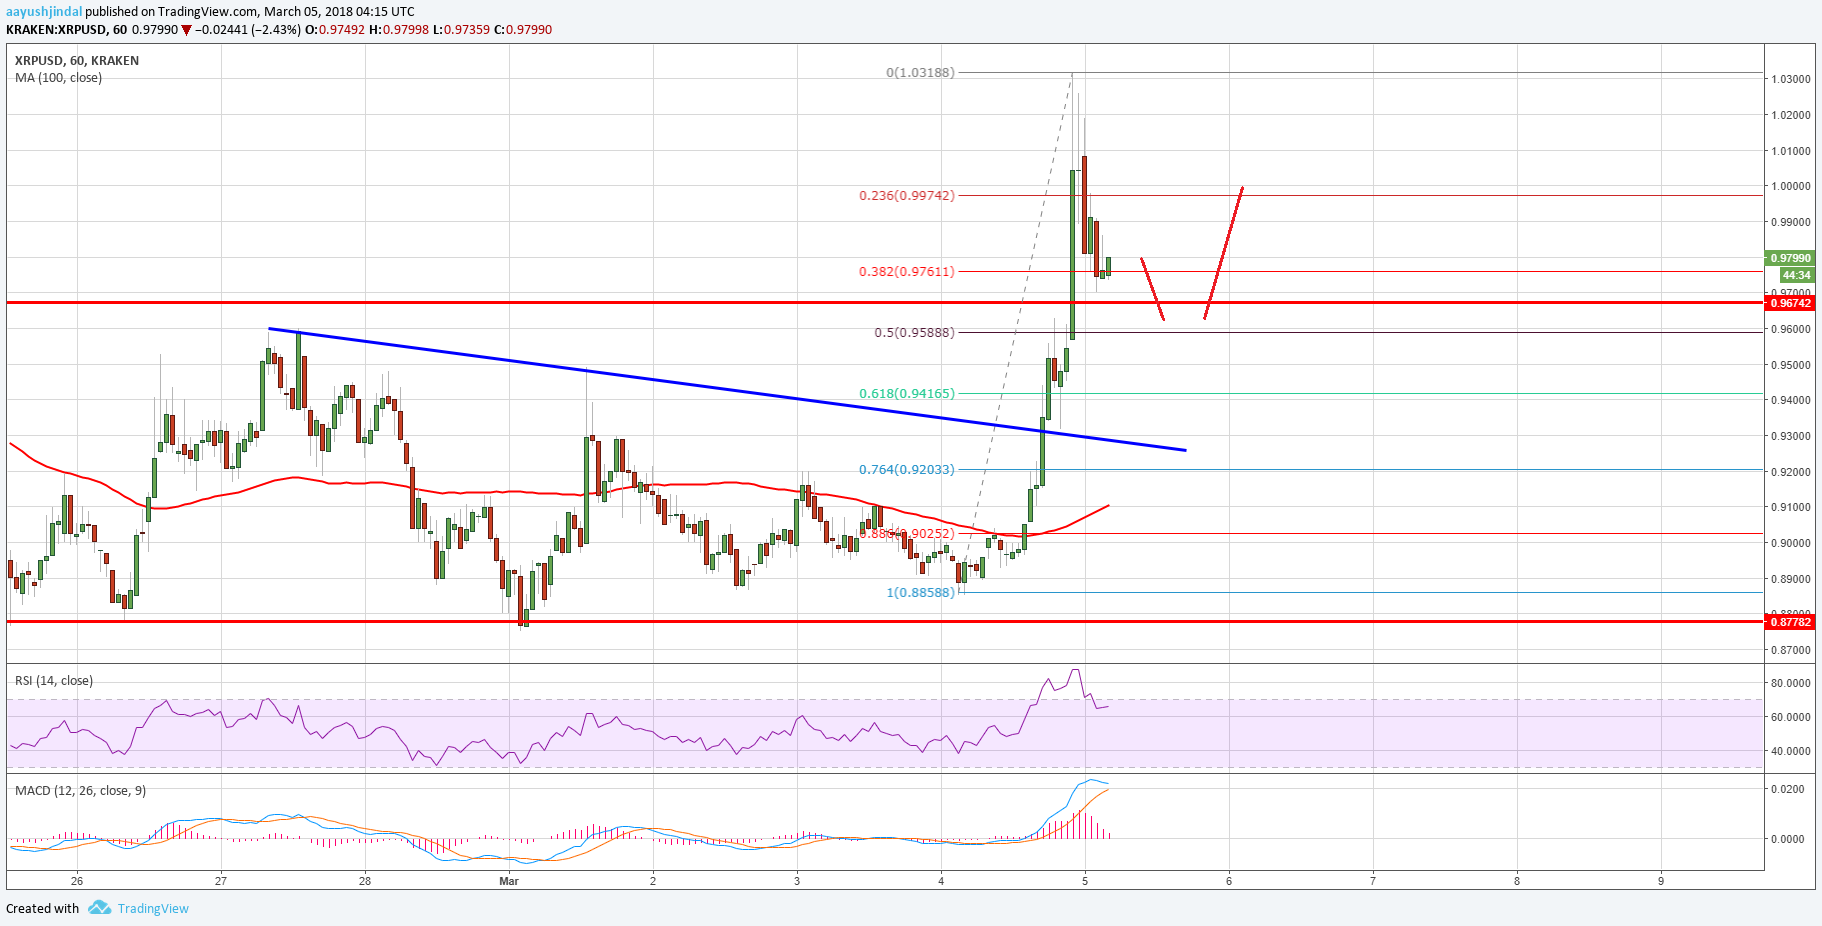
As long as the price is above $0.9400, it may continue to move higher. On the upside, resistances are seen near the $1.00 and $1.02 levels, followed by the recent high of $1.031.
Looking at the technical indicators:
Hourly MACD – The MACD for XRP/USD is slowly reducing its bullish slope.
Hourly RSI (Relative Strength Index) – The RSI for XRP/USD is currently well above the 50 level.
Major Support Level – $0.9400
Major Resistance Level – $1.0200
Charts courtesy – Trading View


