
Reason to trust
How Our News is Made
Strict editorial policy that focuses on accuracy, relevance, and impartiality
Ad discliamer
Morbi pretium leo et nisl aliquam mollis. Quisque arcu lorem, ultricies quis pellentesque nec, ullamcorper eu odio.
Key Highlights
- Ripple price started an upside recovery and moved above the $0.4800 level against the US dollar.
- There was a break above yesterday’s highlighted crucial bearish trend line with resistance at $0.4880 on the hourly chart of the XRP/USD pair (data source from Kraken).
- The pair may continue to rise towards the next resistance near the $0.5180 level.
Ripple price is showing a few positive signs against the US Dollar and Bitcoin. XRP/USD could correct further higher as long as it is above $0.4800.
Ripple Price Support
There was a decent upside move started from the $0.4485 swing low in Ripple price against the US Dollar. The price traded higher and succeeded in trading above the $0.4750 resistance. Moreover, there was a break above the 23.6% Fib retracement level of the last downside move from the $0.5491 high to $0.4487 low. These are positive signs above the $0.4750 level.
More importantly, there was a break above yesterday’s highlighted crucial bearish trend line with resistance at $0.4880 on the hourly chart of the XRP/USD pair. The pair also succeeded in settling above the $0.4800 level and the 100 hourly simple moving average. At the moment, the price is trading just above the 50% Fib retracement level of the last downside move from the $0.5491 high to $0.4487 low. It may continue to rise towards the $0.5100 and $0.5180 resistance levels if the price gains traction.
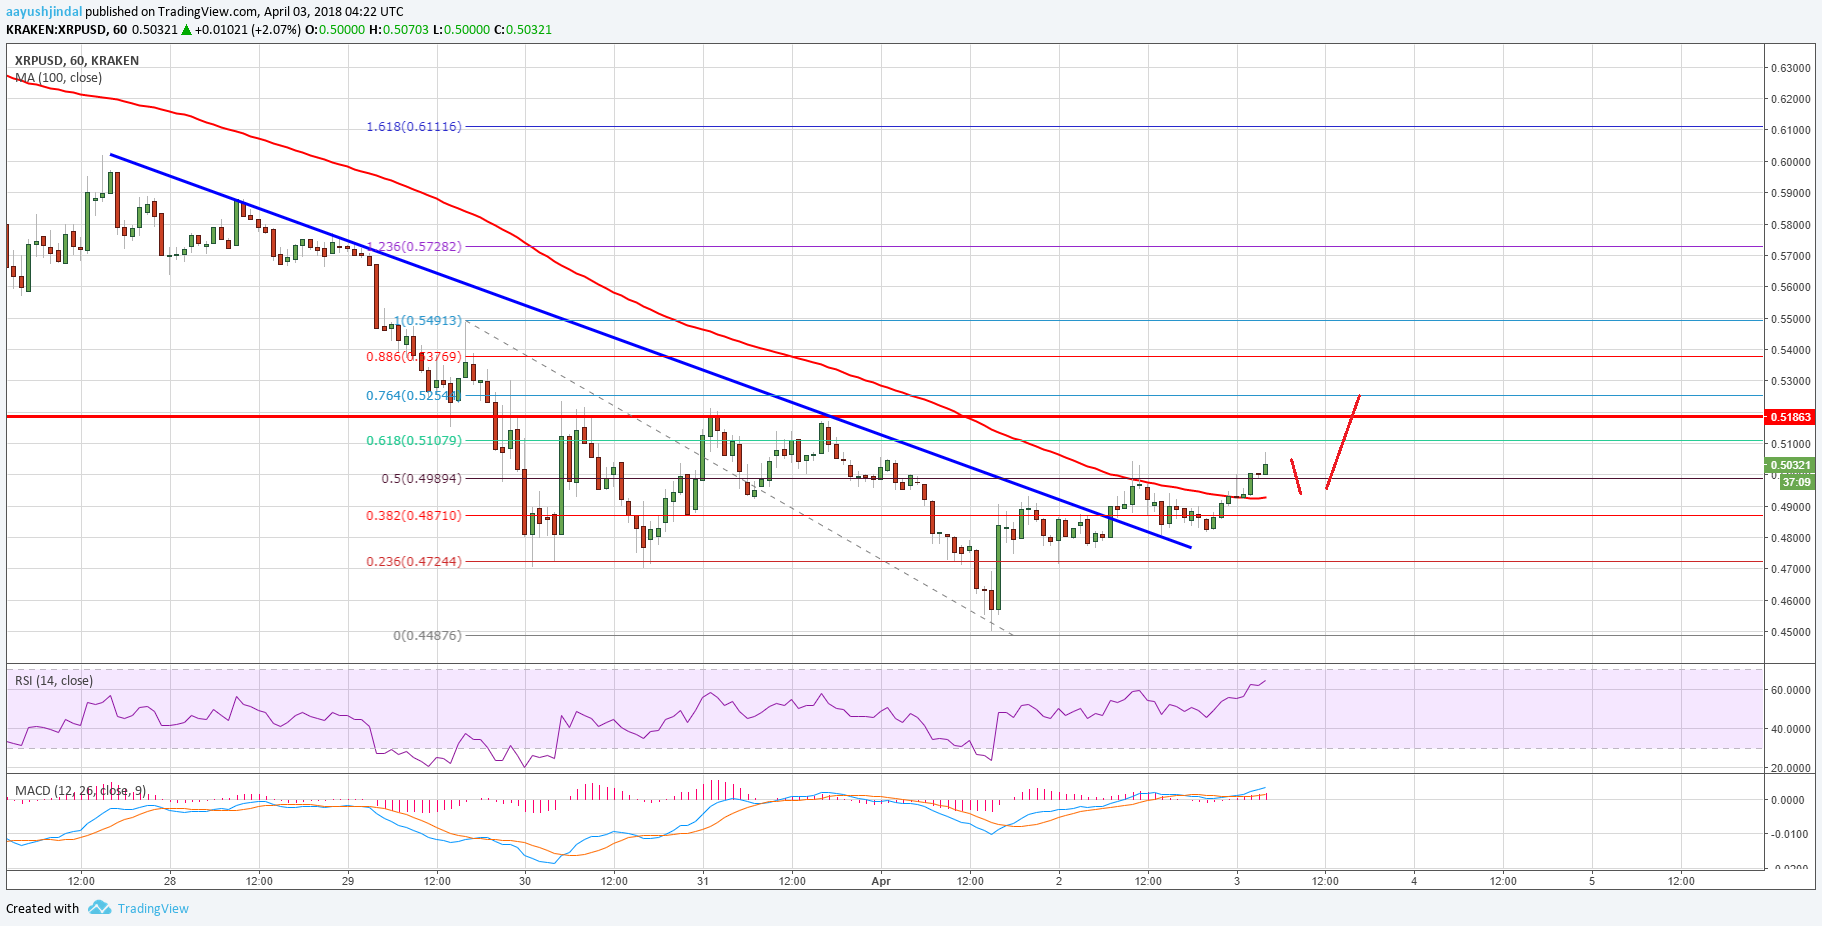
Above $0.5180, the price could even trade towards the $0.5500 level. On the downside, the 100 hourly SMA and $0.4900 is a short-term support. Below $0.4900, the $0.4800 support must holds declines. If the price fails to stay above $0.4800, there could be a retest of the $0.4500 level.
Looking at the technical indicators:
Hourly MACD – The MACD for XRP/USD is slowly gaining pace in the bullish zone.
Hourly RSI (Relative Strength Index) – The RSI for XRP/USD is now well above the 50 level.
Major Support Level – $0.4800
Major Resistance Level – $0.5180
Charts courtesy – Trading View


