
Reason to trust
How Our News is Made
Strict editorial policy that focuses on accuracy, relevance, and impartiality
Ad discliamer
Morbi pretium leo et nisl aliquam mollis. Quisque arcu lorem, ultricies quis pellentesque nec, ullamcorper eu odio.
Key Highlights
- Ripple price is currently under pressure and is currently below $2.70 against the US Dollar.
- There was a break below a connecting bullish trend line with support at $2.70 on the hourly chart of the XRP/USD pair (data source from Kraken).
- On the upside, there is a key resistance forming around $2.80 and the 100 hourly simple moving average.
Ripple price is struggling to retain the bullish bias against the US Dollar and Bitcoin. XRP/USD may decline in the short term towards the $2.40 and $2.30 levels.
Ripple Price Decline
There was a recovery initiated from the $2.15 swing low in Ripple price against the US Dollar. The price recovered above the $2.30 level and the 23.6% Fib retracement level of the last decline from the $3.35 high to $2.15 low. However, the upside recovery was limited and the price was not able to move above $2.80. There was also no proper close above the 100 hourly simple moving average, which is currently at $2.75.
Moreover, the price failed to break the 50% Fib retracement level of the last decline from the $3.35 high to $2.15 low. There was a fresh downside wave initiated from the $2.80 swing high. During the downside, there was a break below a connecting bullish trend line with support at $2.70 on the hourly chart of the XRP/USD pair. The pair is now struggling to recover and is currently below $2.60 and the 100 hourly SMA.
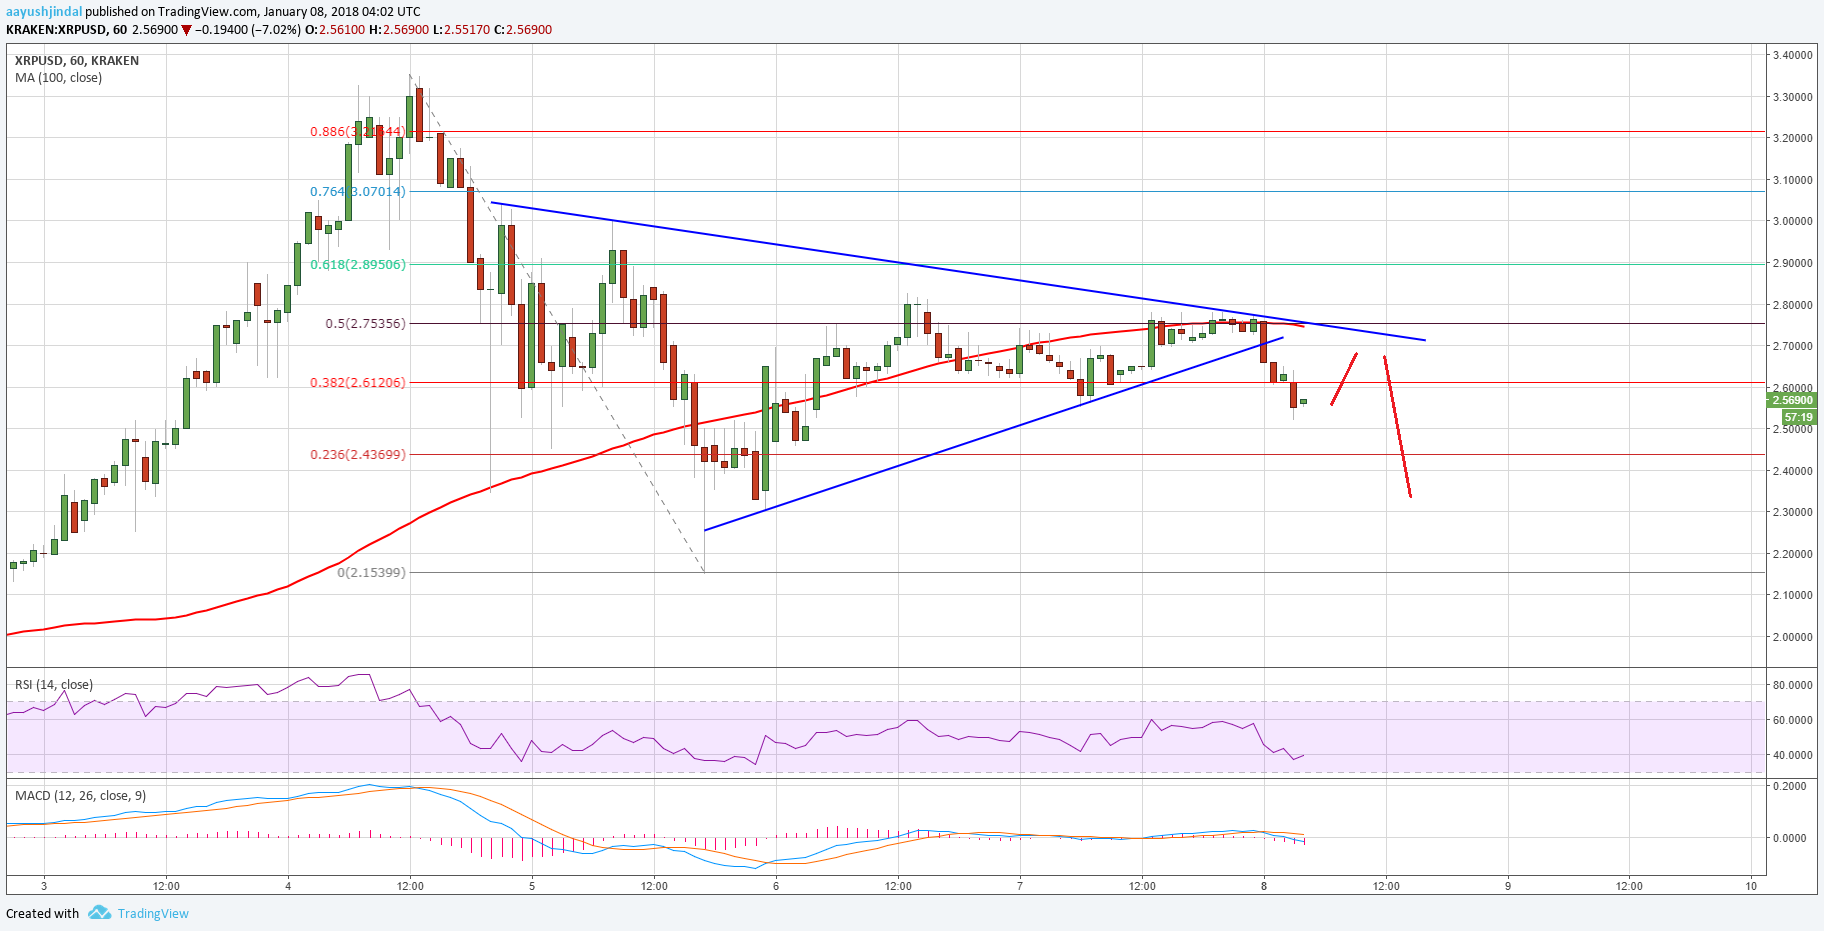
On the upside, there is a major bearish trend line forming with resistance at $2.75 on the same chart. If the pair corrects higher, it could face sellers near $2.75-2.80. On the downside, it seems like the pair may decline and test the $2.40 support.
Looking at the technical indicators:
Hourly MACD – The MACD for XRP/USD is currently in the bearish zone.
Hourly RSI (Relative Strength Index) – The RSI for XRP/USD is now below the 40 level.
Major Support Level – $2.40
Major Resistance Level – $2.80
Charts courtesy – Trading View, Kraken


“…. XRP/USD may decline in the short term towards the $2.40 and $2.30 levels” –>> getting close