
Reason to trust
How Our News is Made
Strict editorial policy that focuses on accuracy, relevance, and impartiality
Ad discliamer
Morbi pretium leo et nisl aliquam mollis. Quisque arcu lorem, ultricies quis pellentesque nec, ullamcorper eu odio.
Key Highlights
- Ripple price is moving higher from the $0.2050 support zone against the US Dollar.
- There is an ascending channel forming with support near $0.2320 on the hourly chart of the XRP/USD pair (data source from Kraken).
- The pair is likely to continue gaining pace as long as it stays above $0.2300 and the 100 hourly simple moving average.
Ripple price is slowly gaining bullish momentum against the US Dollar and Bitcoin. XRP/USD is currently well supported on the downside near $0.2300.
Ripple Price Support
After a sharp correction towards $0.2050, Ripple price found support against the US Dollar. The price started an upside move and traded above the $0.2300 and $0.2400 resistance levels. It recently tested the $0.2500 resistance where it struggled and started a downside correction. It has moved below the 23.6% Fib retracement level of the last wave from the $0.2050 low to $0.2500 high.
However, the downside move is finding support near $0.2300 and 100 hourly simple moving average. Moreover, the 38.2% Fib retracement level of the last wave from the $0.2050 low to $0.2500 high also acted as a support. It seems like there is an ascending channel forming with support near $0.2320 on the hourly chart of the XRP/USD pair. As long as the pair is above the $0.2300 support and the 100 hourly SMA, it remains in an uptrend.
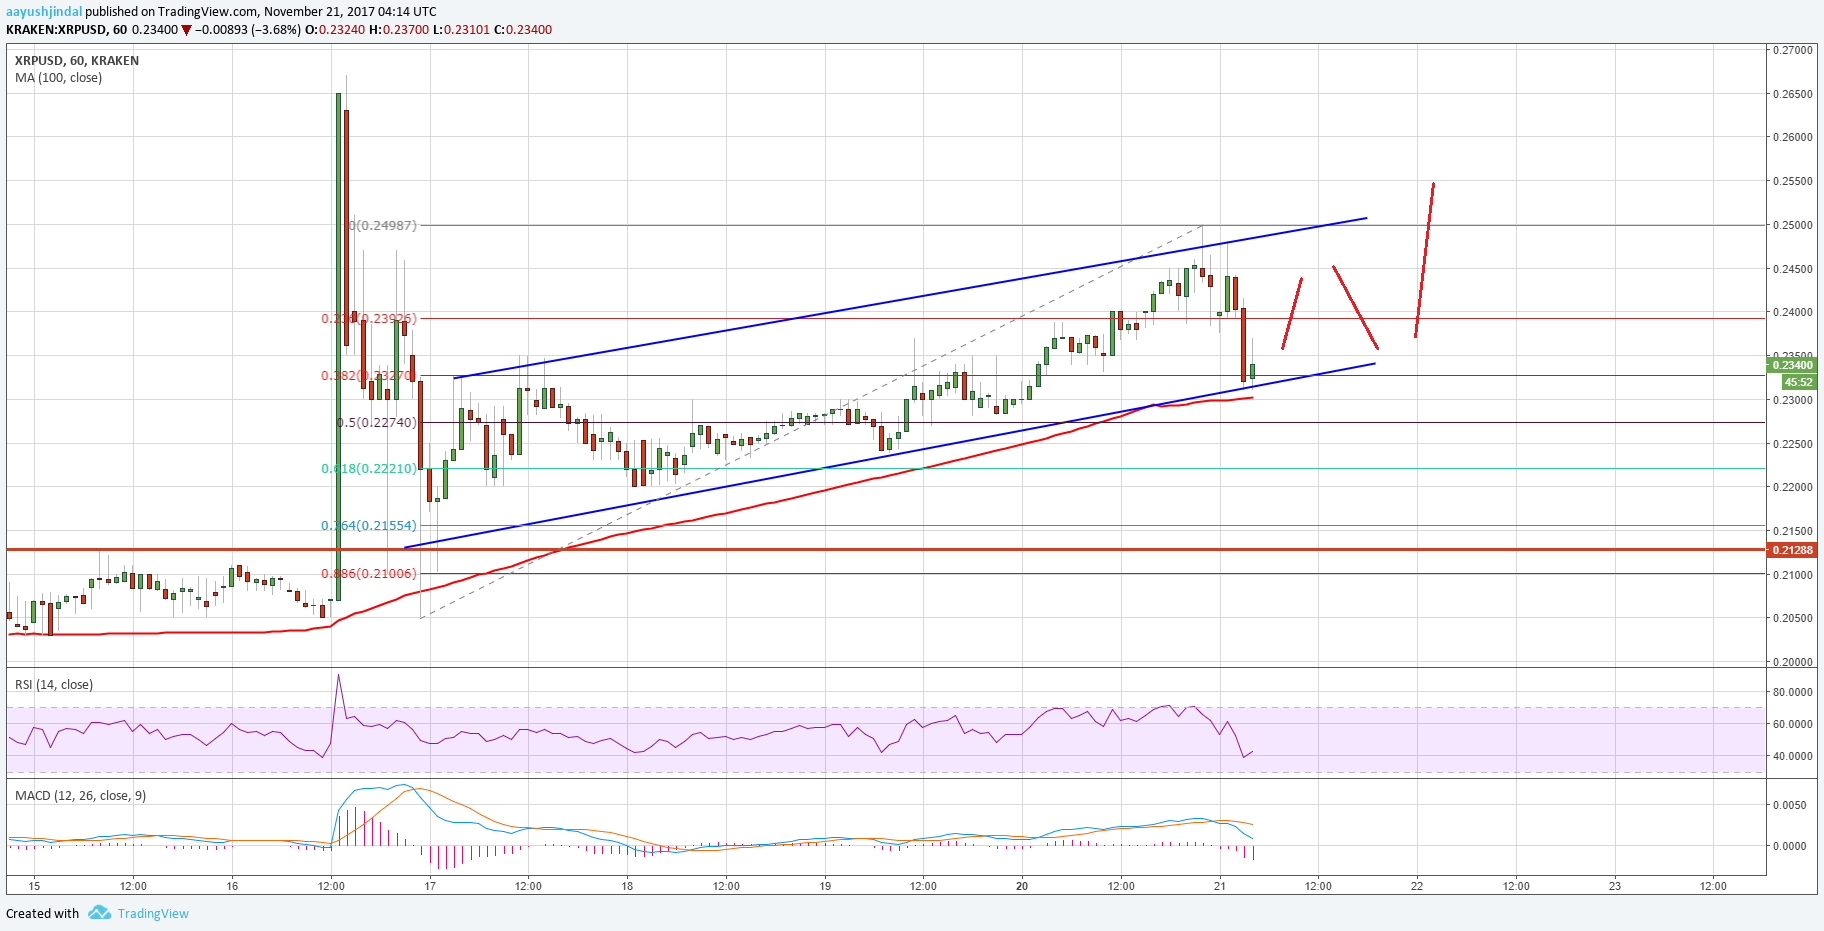
It will most likely resume its upside move towards $0.2500 in the near term. Above $0.2500, the price could move towards the last swing high of $0.2650. On the downside, a break below the $0.2300 support would call for more declines. The next important support in the mentioned case is around $0.2150.
Looking at the technical indicators:
Hourly MACD – The MACD for XRP/USD is currently in the bearish zone.
Hourly RSI (Relative Strength Index) – The RSI for XRP/USD is currently well below the 50 level.
Major Support Level – $0.2300
Major Resistance Level – $0.2500
Charts courtesy – Trading View, Kraken


