
Reason to trust
How Our News is Made
Strict editorial policy that focuses on accuracy, relevance, and impartiality
Ad discliamer
Morbi pretium leo et nisl aliquam mollis. Quisque arcu lorem, ultricies quis pellentesque nec, ullamcorper eu odio.
Key Highlights
- Ripple price declined sharply from the $2.80 swing high to well below $2.00 against the US Dollar.
- There is a major bearish trend line forming with resistance at $2.50 on the hourly chart of the XRP/USD pair (data source from Kraken).
- The price may continue to struggle to break the $2.50 resistance and the 100 hourly simple moving average.
Ripple price is under bearish pressure against the US Dollar and Bitcoin. XRP/USD could face an increase selling pressure around $2.50 in the near term.
Ripple Price Resistance
Yesterday, I pointed out an increase in selling pressure on Ripple price below $3.00 against the US Dollar. The price failed to make an upside move above $2.80 and started a major decline. The downside move was very strong as the price dipped below the $2.50 and $2.00 support levels. It even moved below the $1.80 support and traded as low as $1.6126. Later, an upside correction was initiated and the price moved above the 50% Fib retracement level of the last decline from the $2.80 high to $1.61 low.
However, the price is facing a lot of hurdles near $2.50-2.60. There is a major bearish trend line forming with resistance at $2.50 on the hourly chart of the XRP/USD pair. The trend line resistance is also around the 100 hourly simple moving average at $2.60. Moreover, there was no proper break of the 76.4% Fib retracement level of the last decline from the $2.80 high to $1.61 low. Therefore, there is a risk of more losses in the near term from $2.50. Should the price succeeds in moving above $2.50, there can be more recoveries toward $2.80.
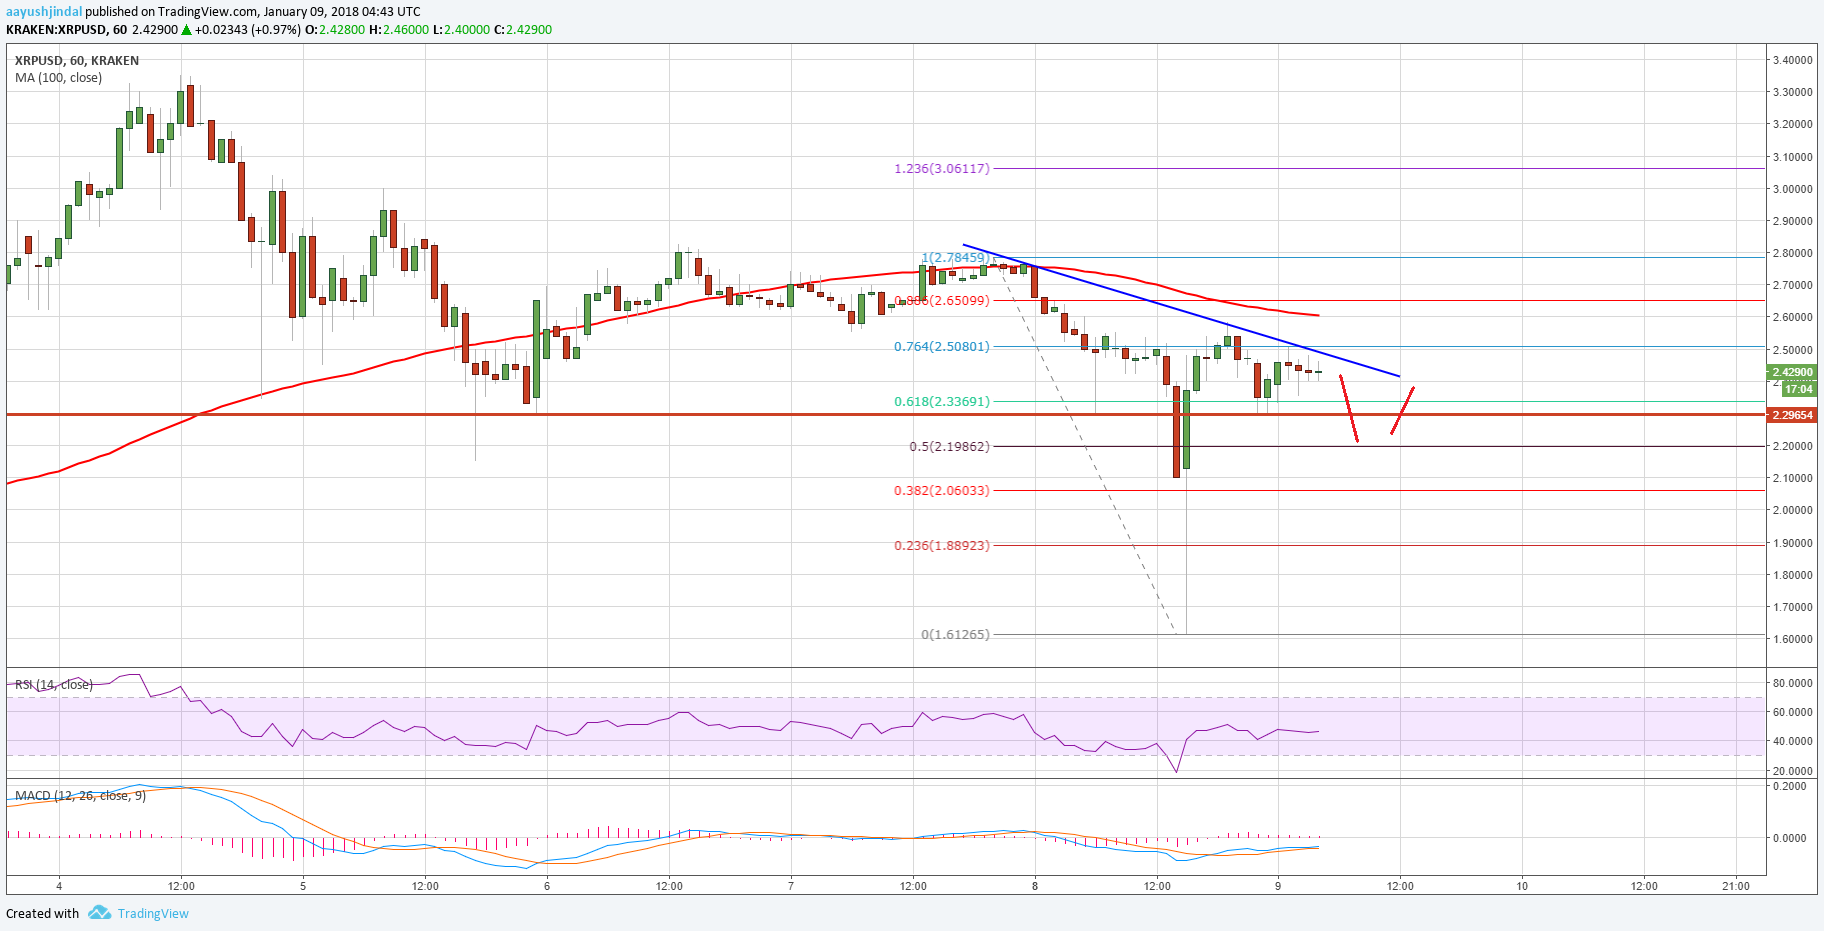
On the downside, the $2.20 and $2.00 levels are decent supports and buy zones.
Looking at the technical indicators:
Hourly MACD – The MACD for XRP/USD is slightly in the bullish zone.
Hourly RSI (Relative Strength Index) – The RSI for XRP/USD is still below the 50 level.
Major Support Level – $2.20
Major Resistance Level – $2.50
Charts courtesy – Trading View, Kraken


