
Reason to trust
How Our News is Made
Strict editorial policy that focuses on accuracy, relevance, and impartiality
Ad discliamer
Morbi pretium leo et nisl aliquam mollis. Quisque arcu lorem, ultricies quis pellentesque nec, ullamcorper eu odio.
Key Highlights
- Ripple price is holding a major support level near $0.6550 against the US dollar.
- There is a short-term declining channel forming with resistance near $0.6900 on the hourly chart of the XRP/USD pair (data source from Kraken).
- The pair remains supported on the downside above the $0.6500 level and the 100 hourly simple moving average.
Ripple price is consolidating gains against the US Dollar and Bitcoin. XRP/USD may dip a few points, but it remains supported above the $0.6500 level.
Ripple Price Trend
There was a slow and steady upside move in Ripple price above the $0.6200 against the US Dollar. The price traded higher and moved above the $0.7000 level. It is now trading in a bullish zone above the $0.6560 level and the 100 hourly simple moving average. The recent high was formed at $0.7258 from where a downside correction was initiated.
XRP price has moved below the 23.6% Fib retracement level of the last wave from the $0.5342 low to $0.7258 high. There is also a short-term declining channel forming with resistance near $0.6900 on the hourly chart of the XRP/USD pair. However, the pair remains well supported above the $0.6500 level and the 100 hourly SMA. The stated $0.6500 support is also near the 38.2% Fib retracement level of the last wave from the $0.5342 low to $0.7258 high. Therefore, any major dips from the current levels could find buyers above $0.6500.
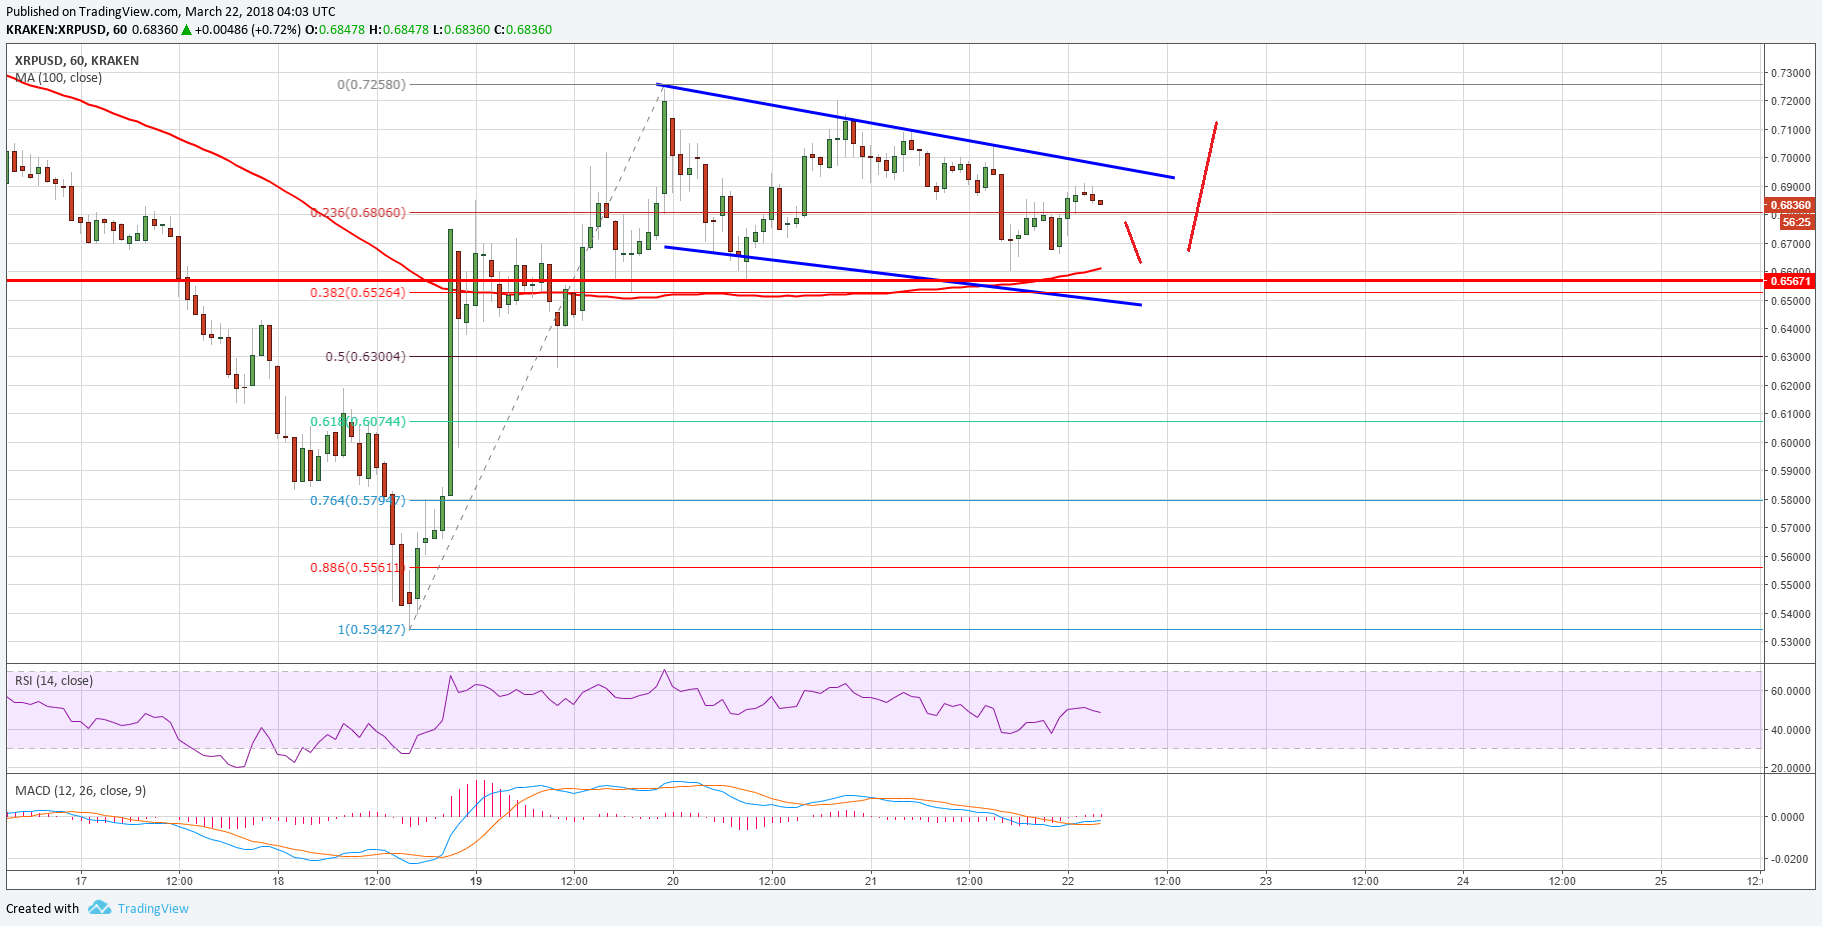
A break below the $0.6500 support and a close below the 100 hourly SMA may push the price in a bearish zone. On the upside, the channel resistance at $0.6900 must be breached for a retest of $0.7250. Above $0.7250, the price may rise towards the $0.7400 level.
Looking at the technical indicators:
Hourly MACD – The MACD for XRP/USD is about to move into the bullish zone.
Hourly RSI (Relative Strength Index) – The RSI for XRP/USD is currently just below the 50 level.
Major Support Level – $0.6500
Major Resistance Level – $0.6900
Charts courtesy – Trading View


