
Reason to trust
How Our News is Made
Strict editorial policy that focuses on accuracy, relevance, and impartiality
Ad discliamer
Morbi pretium leo et nisl aliquam mollis. Quisque arcu lorem, ultricies quis pellentesque nec, ullamcorper eu odio.
Key Highlights
- Ripple price is moving higher and is preparing for more gains above the $0.7200 level against the US dollar.
- There is a major bullish trend line forming with support at $0.7000 on the hourly chart of the XRP/USD pair (data source from Kraken).
- The pair is likely to accelerate higher and it may soon test the $0.7500 level in the near term.
Ripple price is showing bullish signs against the US Dollar and Bitcoin. XRP/USD may perhaps rise further above the $0.7200 level to test the $0.7500 resistance.
Ripple Price Support
There is a positive bias forming above the $0.6500 level in Ripple price against the US Dollar. The price traded above the $0.7000 level recently and formed a high at $0.7197. Later, it started a downside move and traded below the $0.7000 support. However, the downside move was protected by the $0.6500-0.6600 support. As a result, the price moved back higher and is currently trading above $0.7000.
On the downside, there is a major bullish trend line forming with support at $0.7000 on the hourly chart of the XRP/USD pair. The pair tested the $0.7200 resistance area once again, failed and declined below 23.6% Fib retracement level of the last decline from the $0.7197 high to $0.6588 low. It seems like the current price action is positive above the $0.7000 level. If the price remains above $0.7000, it could soon break the $0.7200 resistance.
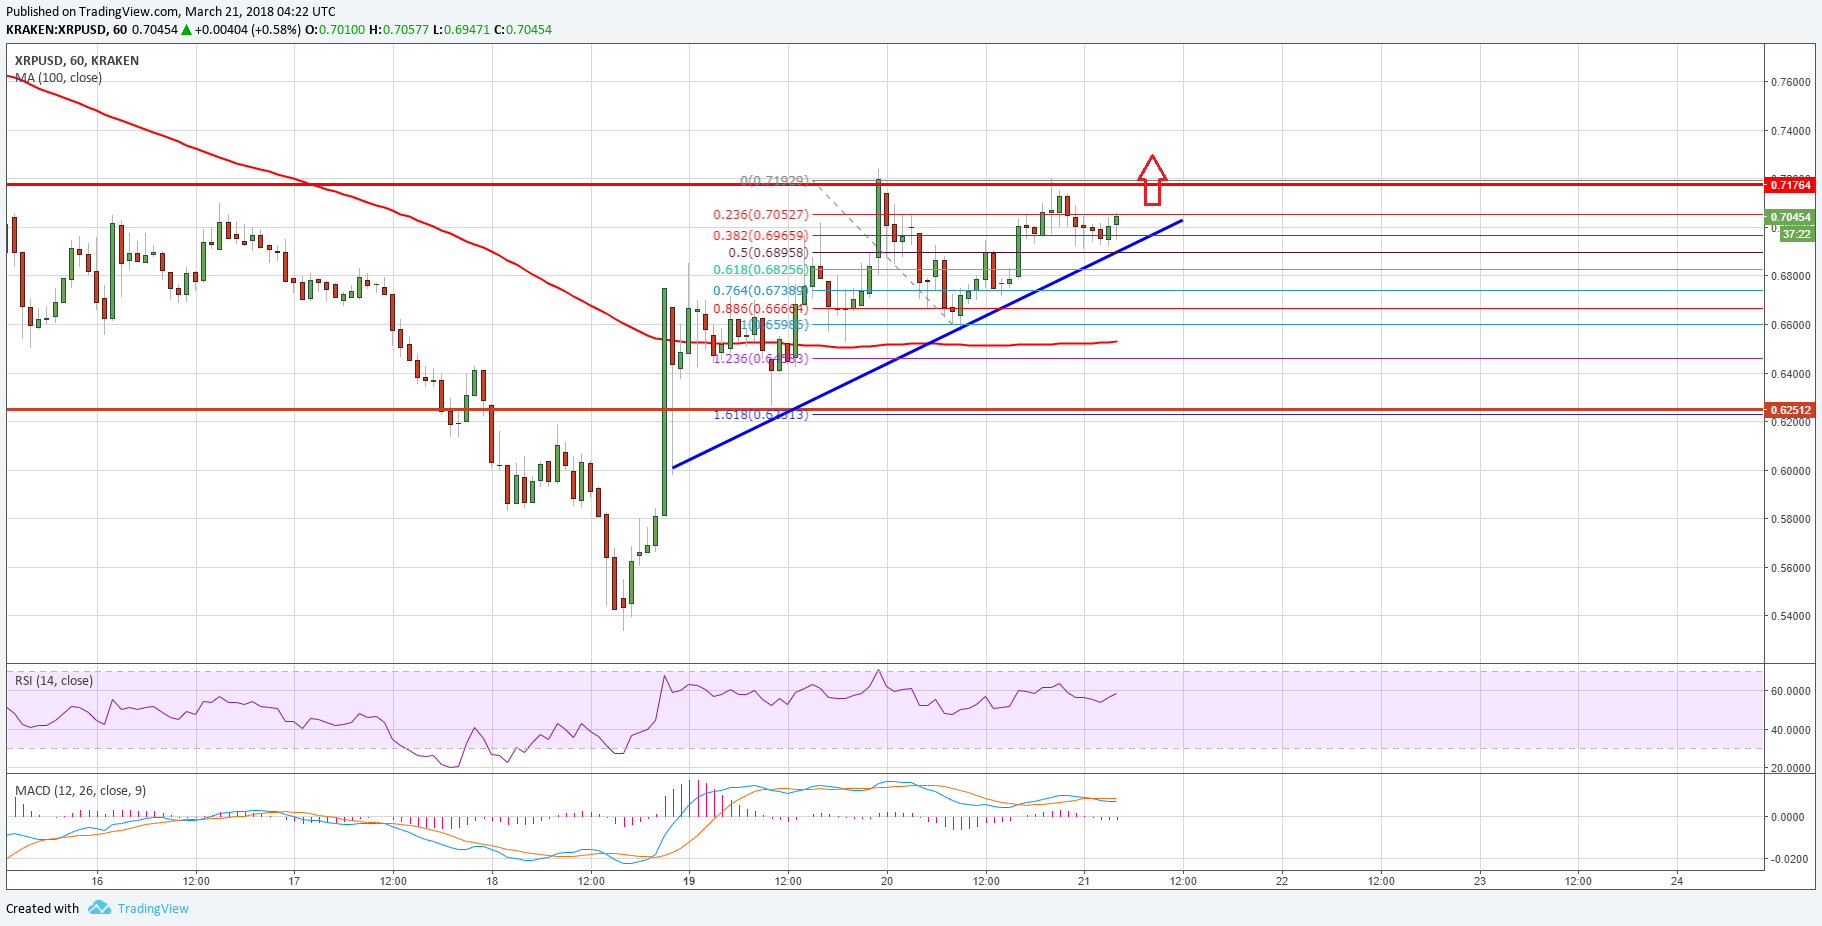
Above the mentioned $0.7200, the price may test the $0.7500 level in the near term. The overall technical structure is positive with supports at $0.7000 and $0.6800. The most important support on the downside is near the $0.6500 level, followed by the 100 hourly simple moving average.
Looking at the technical indicators:
Hourly MACD – The MACD for XRP/USD is slowly moving in the bullish zone.
Hourly RSI (Relative Strength Index) – The RSI for XRP/USD is currently well above the 50 level.
Major Support Level – $0.7000
Major Resistance Level – $0.7200
Charts courtesy – Trading View


