
Reason to trust
How Our News is Made
Strict editorial policy that focuses on accuracy, relevance, and impartiality
Ad discliamer
Morbi pretium leo et nisl aliquam mollis. Quisque arcu lorem, ultricies quis pellentesque nec, ullamcorper eu odio.
Key Highlights
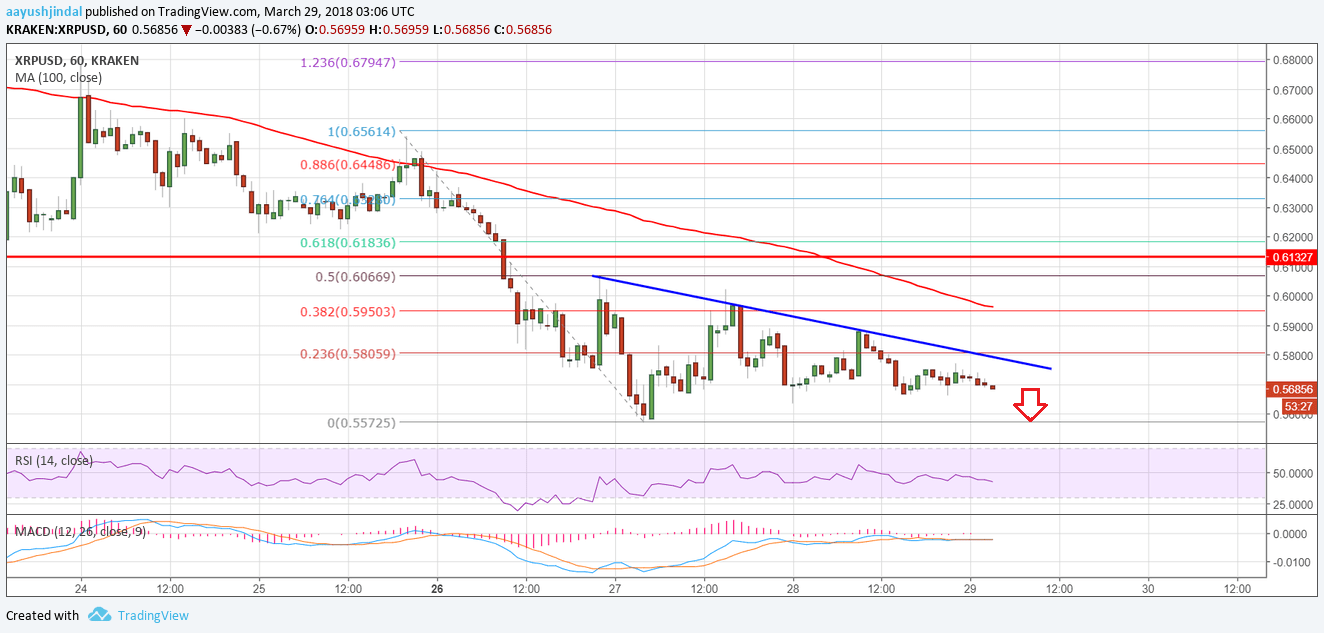
- Ripple price is trading well below the $0.5900 resistance and pivot level against the US dollar.
- There is a major bearish trend line forming with resistance near the $0.5750 on the hourly chart of the XRP/USD pair (data source from Kraken).
- The pair remains at a risk of more losses below the $0.5570 and $0.5500 levels in the near term.
Ripple price is in a major bearish zone against the US Dollar and Bitcoin. XRP/USD may accelerate declines below the $0.5500 level going forward.
Ripple Price Decline
There was no upside correction above $0.5800 and $0.5900 in Ripple price against the US Dollar. The price is still in a bearish zone well below the $0.5800 level. A low was formed at $0.5570 before the price corrected slightly. However, the $0.5900 level acted as a resistance. Moreover, the 38.2% Fib retracement level of the last downside move from the $0.6500 swing high to $0.5572 low also prevented upsides.
The main hurdle on the upside is near a major bearish trend line forming with resistance near the $0.5750 on the hourly chart of the XRP/USD pair. A break above trend line resistance is needed for more gains towards $0.5900. Above $0.5900, the 50% Fib retracement level of the last downside move from the $0.6500 swing high to $0.5572 low may act as the next resistance. Only a close above the $0.6000 level could open the doors for more corrections in the near term.
On the downside, the price may soon break the $0.5572 low. The next major support is near the $0.5000 level. There can be a solid buying interest near the $0.5000 level since it is a key handle for XRP.
Looking at the technical indicators:
Hourly MACD – The MACD for XRP/USD is still placed nicely in the bearish zone.
Hourly RSI (Relative Strength Index) – The RSI for XRP/USD is moving lower and is currently below the 50 level.
Major Support Level – $0.5570
Major Resistance Level – $0.5900
Charts courtesy – Trading View


