
Reason to trust
How Our News is Made
Strict editorial policy that focuses on accuracy, relevance, and impartiality
Ad discliamer
Morbi pretium leo et nisl aliquam mollis. Quisque arcu lorem, ultricies quis pellentesque nec, ullamcorper eu odio.
Key Highlights
- Ripple price is holding a major support area near $0.7500 against the US dollar.
- There is a monster contracting triangle pattern forming with support near $0.7600 on the hourly chart of the XRP/USD pair (data source from Kraken).
- On the upside, the pair is facing a major resistance near the $0.8000 resistance and the 100 hourly simple moving average.
Ripple price is holding key supports against the US Dollar and Bitcoin. XRP/USD has to gain momentum above $0.8000 and $0.8200 to gain traction.
Ripple Price Range
There was no major move above $0.8400 in Ripple price during the past two sessions against the US Dollar. The price tested the $0.8300 level, failed to gain momentum and declined below $0.8200. It moved below the $0.8000 support and the 100 hourly simple moving average. A low was formed at $0.7630 before the price started consolidating losses.
At the moment, the price is just above the 23.6% Fib retracement level of the last decline from the $0.8301 high to $0.7630 low. On the upside, there are many hurdles for buyers near the $0.8000 level and the 100 hourly SMA. The $0.8000 level is also around the 50% Fib retracement level of the last decline from the $0.8301 high to $0.7630 low. Moreover, there is a monster contracting triangle pattern forming with support near $0.7600 on the hourly chart of the XRP/USD pair. The triangle resistance at $0.8150 is a crucial barrier for buyers.
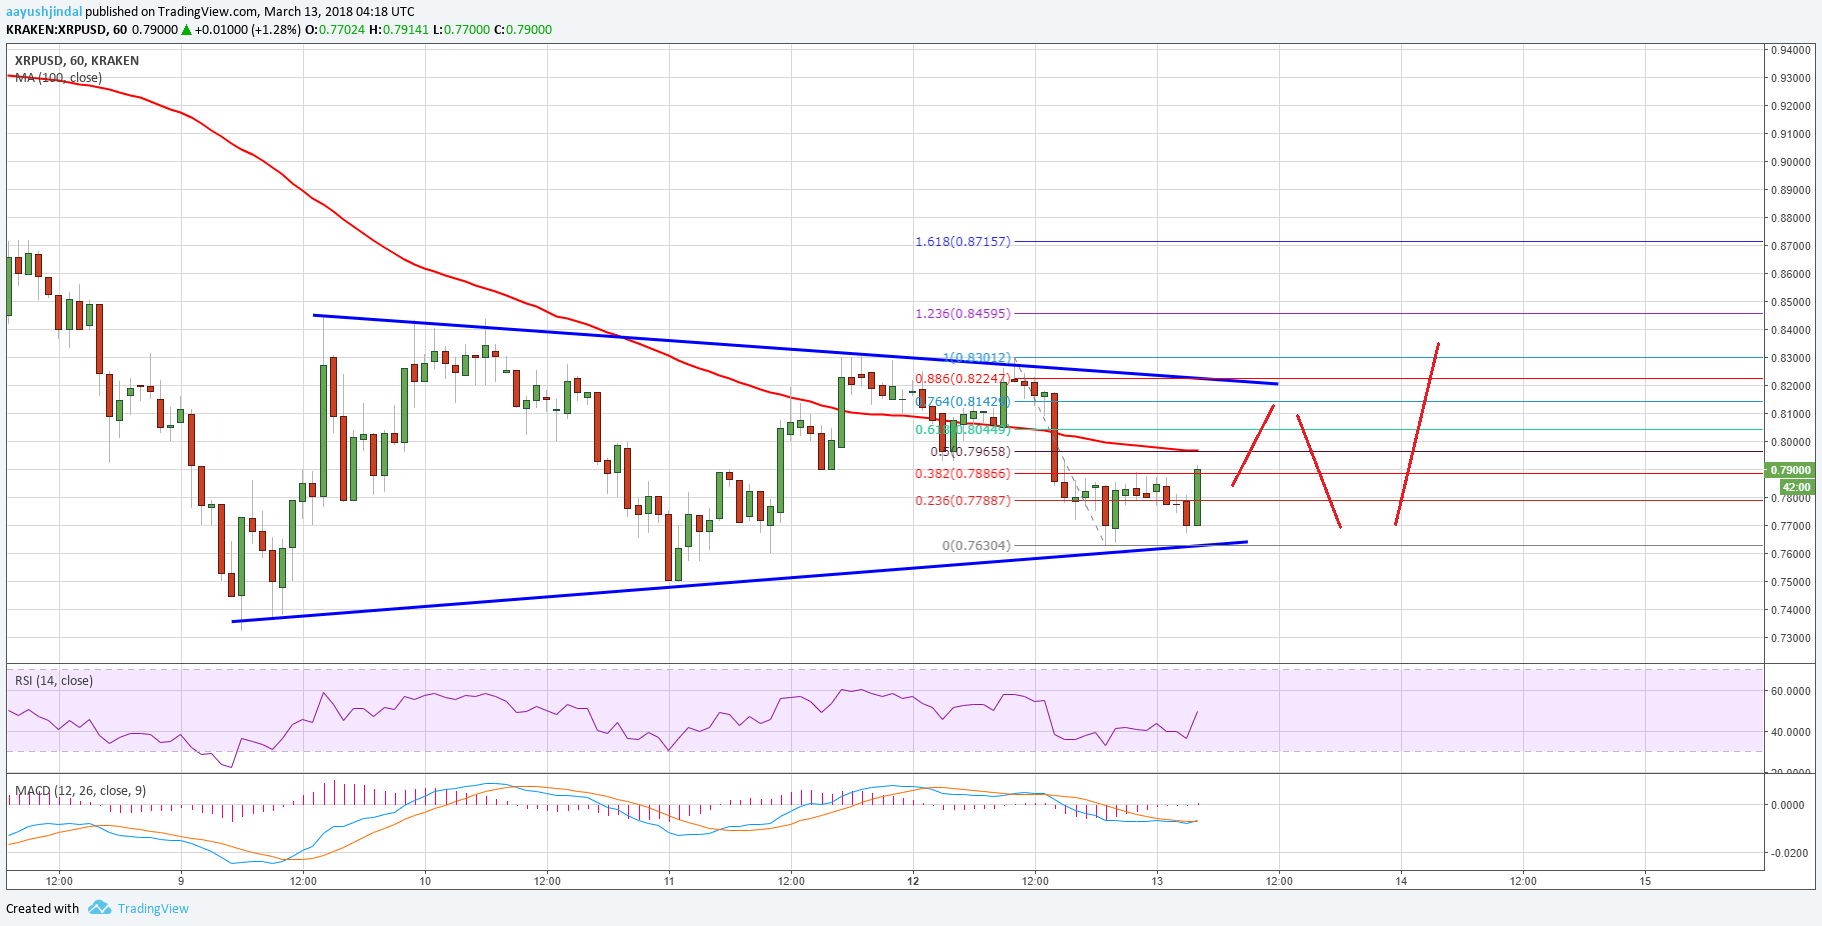
Once there is a proper close above the $0.8200 level and the 100 hourly SMA, there could be more gains. On the downside, the $0.7600 and $0.7500 support levels hold a lot of importance. XRP must stay above $0.7500 to avoid further declines.
Looking at the technical indicators:
Hourly MACD – The MACD for XRP/USD is attempting to move back in the bullish zone.
Hourly RSI (Relative Strength Index) – The RSI for XRP/USD is rising towards the 50 level.
Major Support Level – $0.7600
Major Resistance Level – $0.8200
Charts courtesy – Trading View


