
Reason to trust
How Our News is Made
Strict editorial policy that focuses on accuracy, relevance, and impartiality
Ad discliamer
Morbi pretium leo et nisl aliquam mollis. Quisque arcu lorem, ultricies quis pellentesque nec, ullamcorper eu odio.
Key Highlights
- Ripple price is slowly moving higher but struggling to gain momentum above $0.2500 against the US Dollar.
- This week’s highlighted ascending channel with current support near $0.2380 is active on the hourly chart of the XRP/USD pair (data source from Kraken).
- The pair is currently testing the channel support at $0.2380-90 and might bounce back.
Ripple price is trading with a bullish bias against the US Dollar and Bitcoin. XRP/USD has to remain above $0.2350 to gain further in the near term.
Ripple Price Support
There was no major upside move in Ripple price above $0.2500 against the US Dollar. The price was seen struggling to gain traction above $0.2450 and $0.2500. However, it still remains in an uptrend above $0.2300. More importantly, this week’s highlighted ascending channel with current support near $0.2380 is active on the hourly chart of the XRP/USD pair.
The pair is currently trading near a major support area at $0.2390. The channel support is at $0.2390 along with the 100 hourly simple moving average. Moreover, the 23.6% Fib retracement level of the last wave from the $0.2052 low to $0.2496 high is also around the same support. Therefore, the channel support near $0.2380-90 is very important and must hold losses.
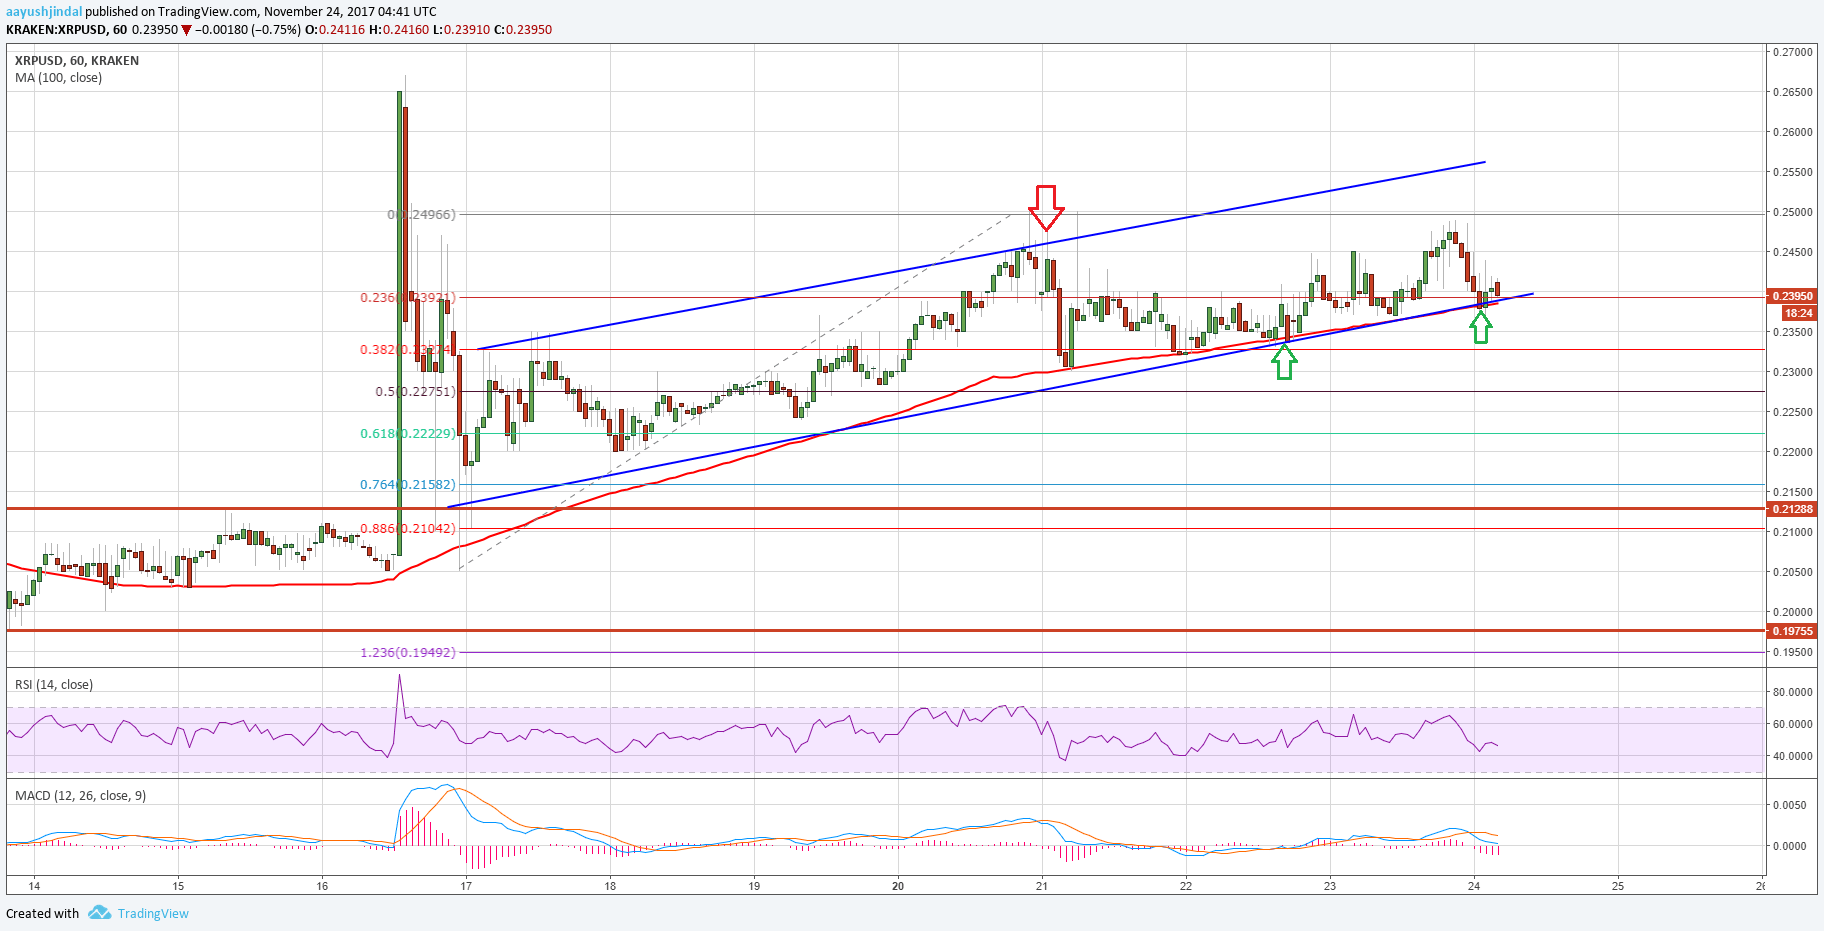
Should there be a break below $0.2380, there is a chance of XRP testing the 50% Fib retracement level of the last wave from the $0.2052 low to $0.2496 high at $0.2275. Below this last, the $0.2050 support can be tested. On the upside, the channel resistance is near $0.2550. Before $0.2550, the $0.2500 level is also a major resistance area, which is preventing upsides towards $0.2600.
Looking at the technical indicators:
Hourly MACD – The MACD for XRP/USD is currently in the bearish zone.
Hourly RSI (Relative Strength Index) – The RSI for XRP/USD is now below the 50 level and is showing bearish signals.
Major Support Level – $0.2380
Major Resistance Level – $0.2500
Charts courtesy – Trading View, Kraken


