
Reason to trust
How Our News is Made
Strict editorial policy that focuses on accuracy, relevance, and impartiality
Ad discliamer
Morbi pretium leo et nisl aliquam mollis. Quisque arcu lorem, ultricies quis pellentesque nec, ullamcorper eu odio.
Key Highlights
- Ripple price declined below the $0.9500 support area yesterday against the US dollar.
- There are two important bearish trend lines forming with resistance at $0.9400 and $1.00 on the hourly chart of the XRP/USD pair (data source from SimpleFx).
- The pair is currently correcting higher, but it is likely to face a lot of sellers on the upside near 0.9500.
Ripple price declined further during the past few hours against the US Dollar and Bitcoin. XRP/USD is currently recovering, but upsides are likely to be capped.
Ripple Price Resistance
There was no respite for buyers as Ripple price declined further below $0.9800 against the US Dollar. The price traded lower and even broke the $0.9500 support level. It was under a lot of pressure, which resulted in a push below $0.9000. A low was formed near $0.8817 from where the price started an upside correction above the $0.9000 level.
It is currently testing the 23.6% Fib retracement level of the last drop from the $1.0811 high to $0.8817 low. There are many hurdles on the upside for buyers starting with $0.9500. Moreover, there are two important bearish trend lines forming with resistance at $0.9400 and $1.00 on the hourly chart of the XRP/USD pair. The second trend line resistance is very important since is it close to $1.00 and the 100 hourly simple moving average. Furthermore, the 50% Fib retracement level of the last drop from the $1.0811 high to $0.8817 low is at $0.9815 to prevent upsides.
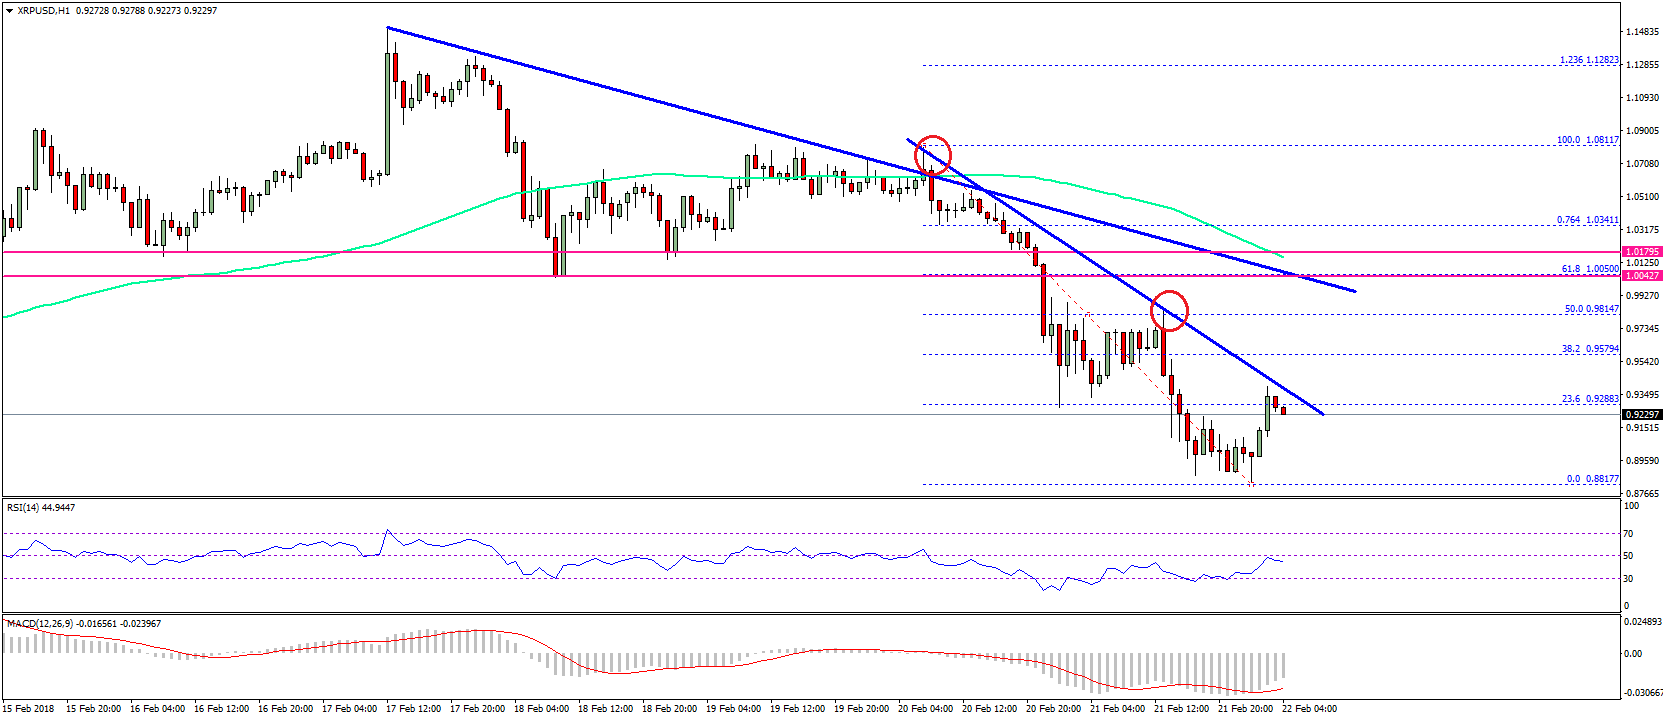
Therefore, if the price corrects higher from the current levels, then it could face sellers near $0.9600 and $0.9800. On the downside, the $0.9000 level is a major support followed by $0.8800.
Looking at the technical indicators:
Hourly MACD – The MACD for XRP/USD is currently reducing its bearish slope.
Hourly RSI (Relative Strength Index) – The RSI for XRP/USD is currently just below the 50 level.
Major Support Level – $0.9000
Major Resistance Level – $0.9800
Charts courtesy – SimpleFX


Comments 1