
Reason to trust
How Our News is Made
Strict editorial policy that focuses on accuracy, relevance, and impartiality
Ad discliamer
Morbi pretium leo et nisl aliquam mollis. Quisque arcu lorem, ultricies quis pellentesque nec, ullamcorper eu odio.
Key Highlights
- Ripple price is currently correcting higher, but it is facing a significant hurdle near $0.4900 against the US dollar.
- There is a crucial bearish trend line forming with resistance around the $0.4900 on the hourly chart of the XRP/USD pair (data source from Kraken).
- The pair has to move above the trend line resistance and $0.5000 to continue moving higher.
Ripple price struggle to recover higher continues against the US Dollar and Bitcoin. XRP/USD may decline once again if it fails to move past the $0.5000 resistance.
Ripple Price Upside Hurdle
There were further declines in Ripple price from well above the $0.6000 level against the US Dollar. The price declined and broke the $0.5500 and $0.5000 support levels. The downside move was strong and the price traded as low as $0.4496 recently. Later, it found bids and started an upside move above the $0.4500 level. It traded above the 23.6% Fib retracement level of the last decline from the $0.5188 high to $0.4496 low.
However, the upside move was protected by a major barrier near the $0.4850-0.4900 zone. There is also a crucial bearish trend line forming with resistance around the $0.4900 on the hourly chart of the XRP/USD pair. Moreover, the 61.8% Fib retracement level of the last decline from the $0.5188 high to $0.4496 low also acted as a barrier for more gains. It seems like the price is struggling to move above the $0.4900 level. Further above, the $0.5000 resistance is the next barrier for buyers.
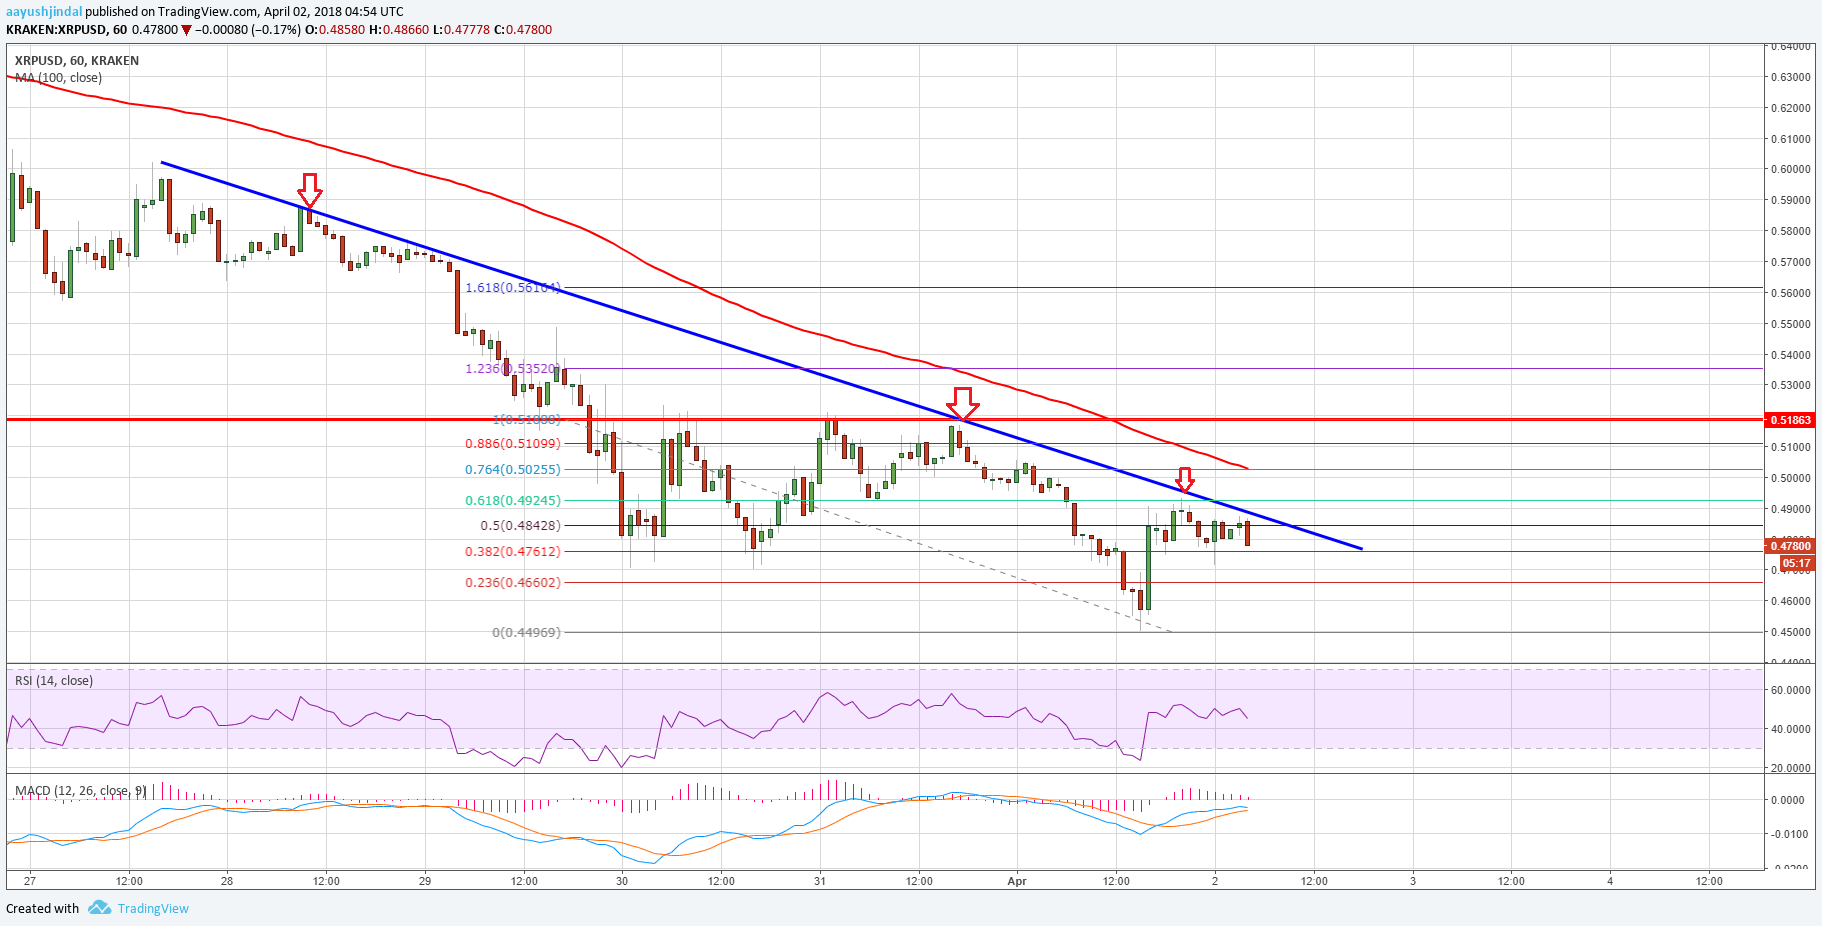
A push above the $0.5000 level may open the doors for an upside move. However, if the price fails to move above the $0.5000 level, it could decline back towards the $0.4500 level.
Looking at the technical indicators:
Hourly MACD – The MACD for XRP/USD is again moving back in the bearish zone.
Hourly RSI (Relative Strength Index) – The RSI for XRP/USD is moving lower towards the 40 level.
Major Support Level – $0.4500
Major Resistance Level – $0.5000
Charts courtesy – Trading View


I think in crypto market most of the Cuurencies facing the struggle.