
Reason to trust
How Our News is Made
Strict editorial policy that focuses on accuracy, relevance, and impartiality
Ad discliamer
Morbi pretium leo et nisl aliquam mollis. Quisque arcu lorem, ultricies quis pellentesque nec, ullamcorper eu odio.
Key Highlights
- Ripple price recovered nicely from the $0.5180 swing low against the US dollar.
- There was a break above yesterday’s highlighted crucial bearish trend line with resistance at $0.6100 on the hourly chart of the XRP/USD pair (data source from SimpleFx).
- The pair faced a major barrier on the upside near $0.7250 and is currently moving lower.
Ripple price recovered in a constructive fashion against the US Dollar and Bitcoin. XRP/USD traded above the $0.6500 level, but it is currently facing a major barrier at $0.7250.
Ripple Price Resistance
Yesterday, we saw a major decline in Ripple price from well above $0.7000 against the US Dollar. The price fell sharply and traded below the $0.6600 and $0.6000 support levels. It even broke the $0.5550 level and traded close to the $0.5000 level. A low was formed at $0.5180 from where the price started an upside correction. It moved above the 23.6% Fib retracement level of the last decline from the $0.9676 high to $0.5180 low.
More importantly, there was a break above yesterday’s highlighted crucial bearish trend line with resistance at $0.6100 on the hourly chart of the XRP/USD pair. The pair traded above the $0.7000 level. However, the upside move faced a major barrier near $0.7250. The mentioned $0.7250 level was a support earlier and now it is acting as a crucial barrier. XRP also failed just below the 50% Fib retracement level of the last decline from the $0.9676 high to $0.5180 low.
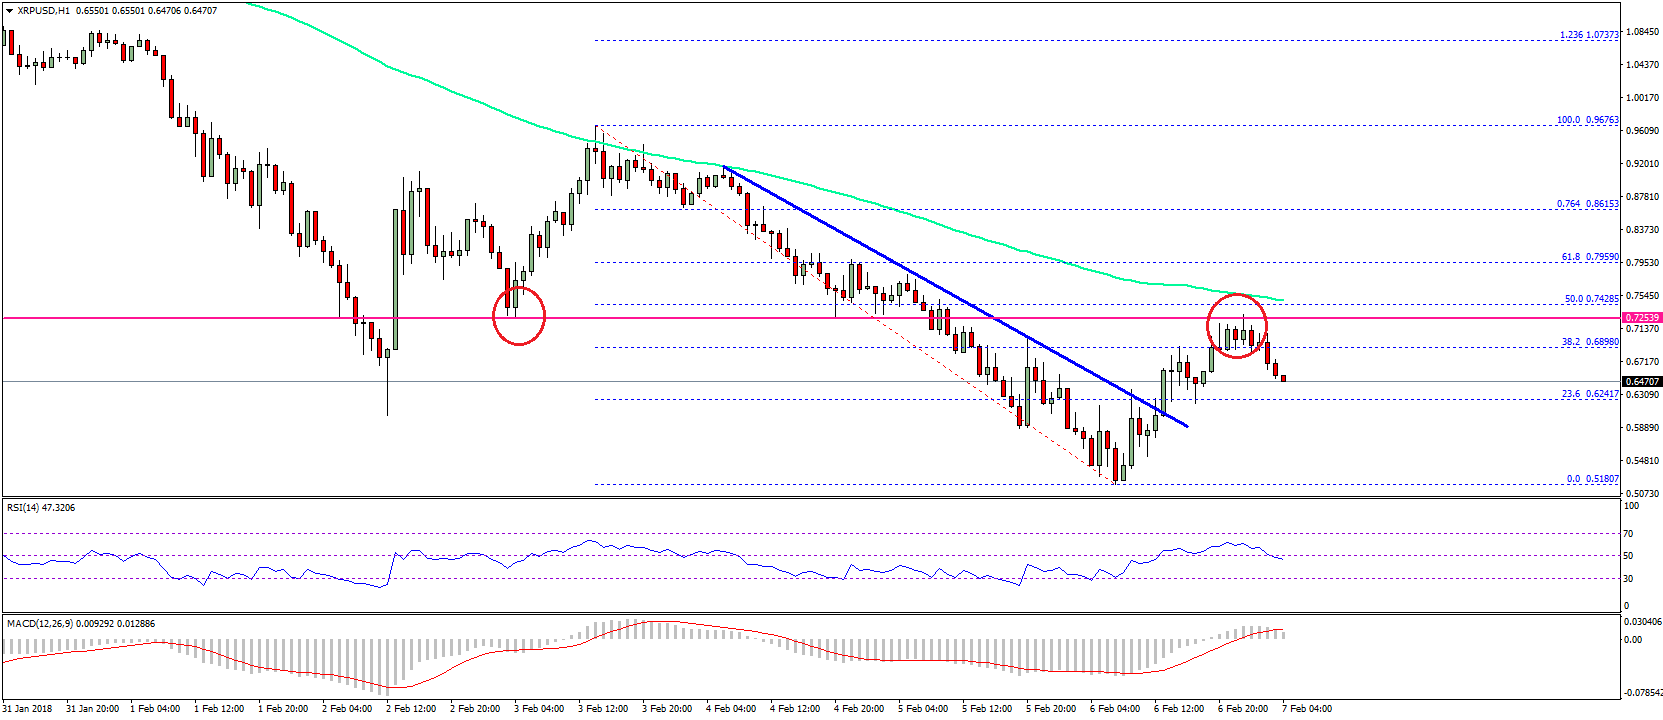
The pair is once again moving lower and is currently trading below $0.7000. An initial support on the downside is at $0.6200, followed by the $0.6000 level. On the upside, a break above the $0.7250 level is needed for more gains in the near term.
Looking at the technical indicators:
Hourly MACD – The MACD for XRP/USD is back in the bullish zone, but with no pace.
Hourly RSI (Relative Strength Index) – The RSI for XRP/USD is struggling to stay above the 50 level.
Major Support Level – $0.6000
Major Resistance Level – $0.7250
Charts courtesy – SimpleFX


