
Reason to trust
How Our News is Made
Strict editorial policy that focuses on accuracy, relevance, and impartiality
Ad discliamer
Morbi pretium leo et nisl aliquam mollis. Quisque arcu lorem, ultricies quis pellentesque nec, ullamcorper eu odio.
Key Highlights
- Ripple price remained under a bearish pressure and it traded below the $2.00 level against the US Dollar.
- Yesterday’s highlighted major bearish trend line with current resistance at $2.25 is intact on the hourly chart of the XRP/USD pair (data source from Kraken).
- The price may extend its decline and it could even trade towards the $1.70 level.
Ripple price is struggling to recover against the US Dollar and Bitcoin. XRP/USD might continue to decline and is currently well below $2.00.
Ripple Price Upside Hurdle
Yesterday, we saw the start of a new downside wave in Ripple price from well above $2.80 against the US Dollar. The price recovered once above the $2.20 level. However, the upside move was capped by the $2.50 level. Moreover, the 61.8% Fib retracement level of the last drop from the $2.82 high to $1.60 low also acted as a hurdle. A new downside wave was initiated and the price moved below the $2.20 level.
There was also break below the 50% Fib retracement level of the last wave from the $1.60 low to $2.58 high. At the moment, the price is below $2.00 and the 100 hourly simple moving average. It seems like the price may extend declines and it could even test the $1.70 level in the short term. On the upside, an initial resistance is at $2.10. Moreover, yesterday’s highlighted major bearish trend line with current resistance at $2.25 is intact on the hourly chart of the XRP/USD pair.
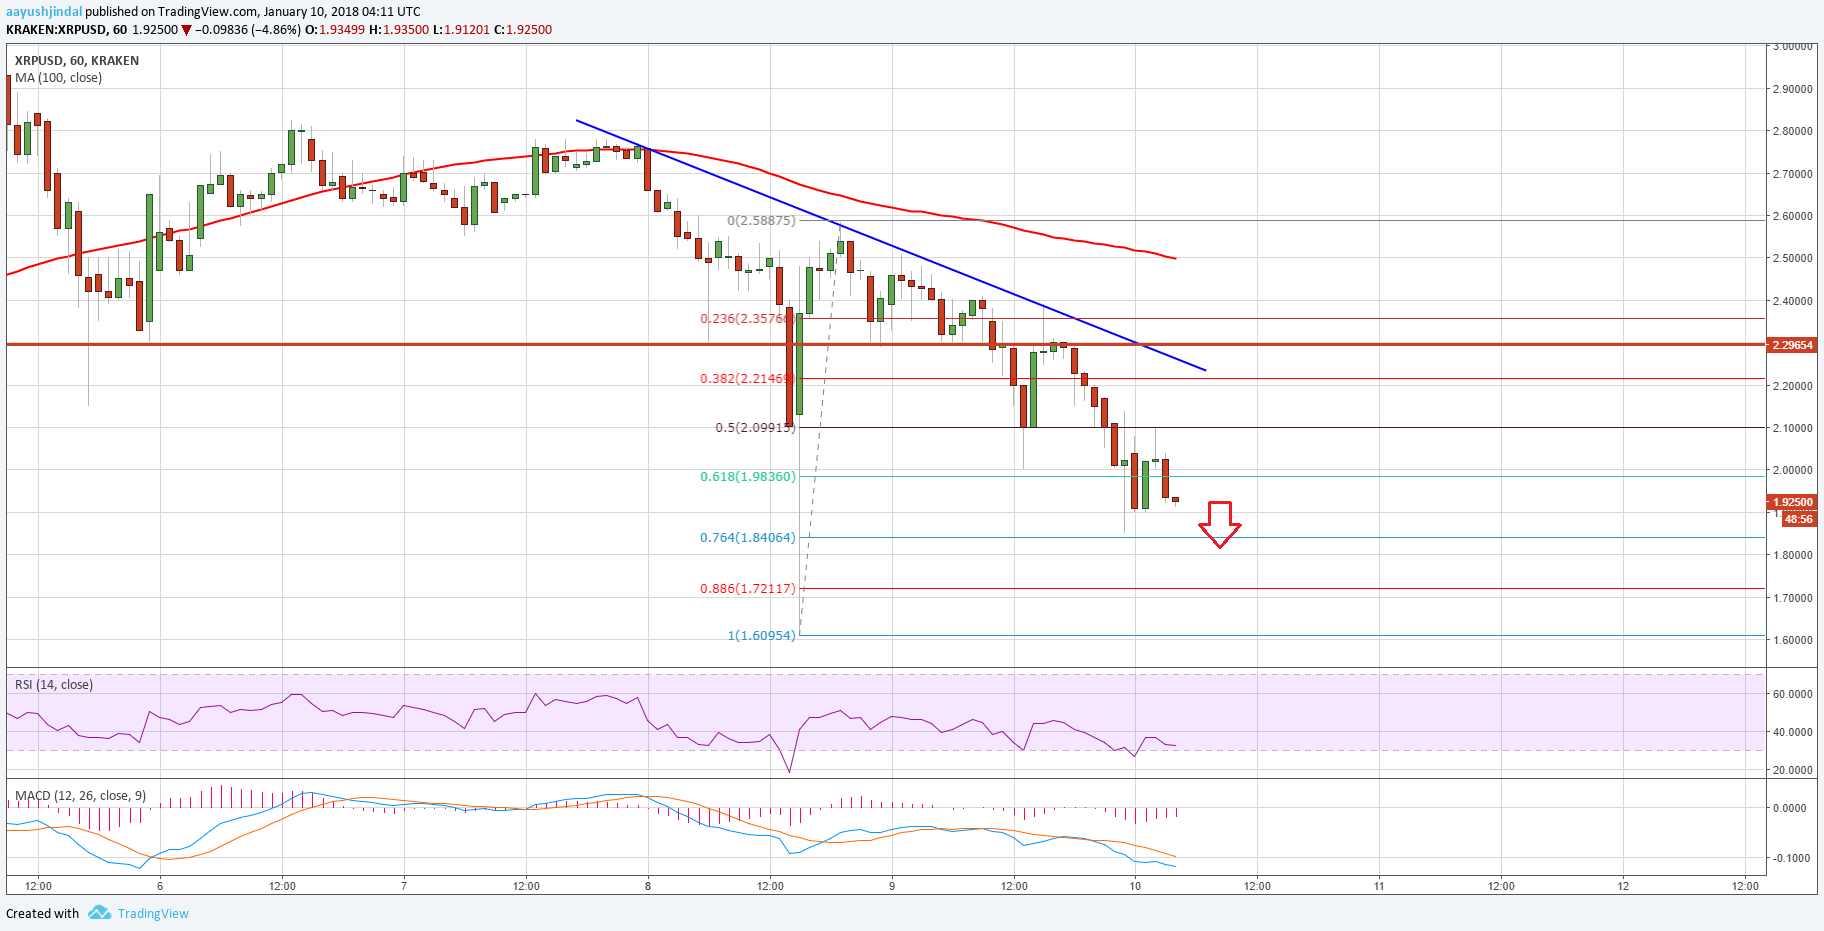
On the downside, an initial support is at $1.85. Moreover, the 76.4% Fib retracement level of the last wave from the $1.60 low to $2.58 high is also around $1.85. Therefore, the $1.85 level may act as a support, but the main support is at $1.70.
Looking at the technical indicators:
Hourly MACD – The MACD for XRP/USD is gaining momentum in the bearish zone.
Hourly RSI (Relative Strength Index) – The RSI for XRP/USD is well below the 40 level.
Major Support Level – $1.70
Major Resistance Level – $2.10
Charts courtesy – Trading View, Kraken


Time to buy into the dip. Although to be honest, I did not expect so much bearish momentum. I am sure it will rebound as several of the AltCoins have been taking a hit lately.
Back to where we were supposed to be before it went crazy after the 25th. Feels like we are back on track after all the hype news.