
Reason to trust
How Our News is Made
Strict editorial policy that focuses on accuracy, relevance, and impartiality
Ad discliamer
Morbi pretium leo et nisl aliquam mollis. Quisque arcu lorem, ultricies quis pellentesque nec, ullamcorper eu odio.
Key Highlights
- Ripple price is trading in a range above the $0.7700 support level against the US dollar.
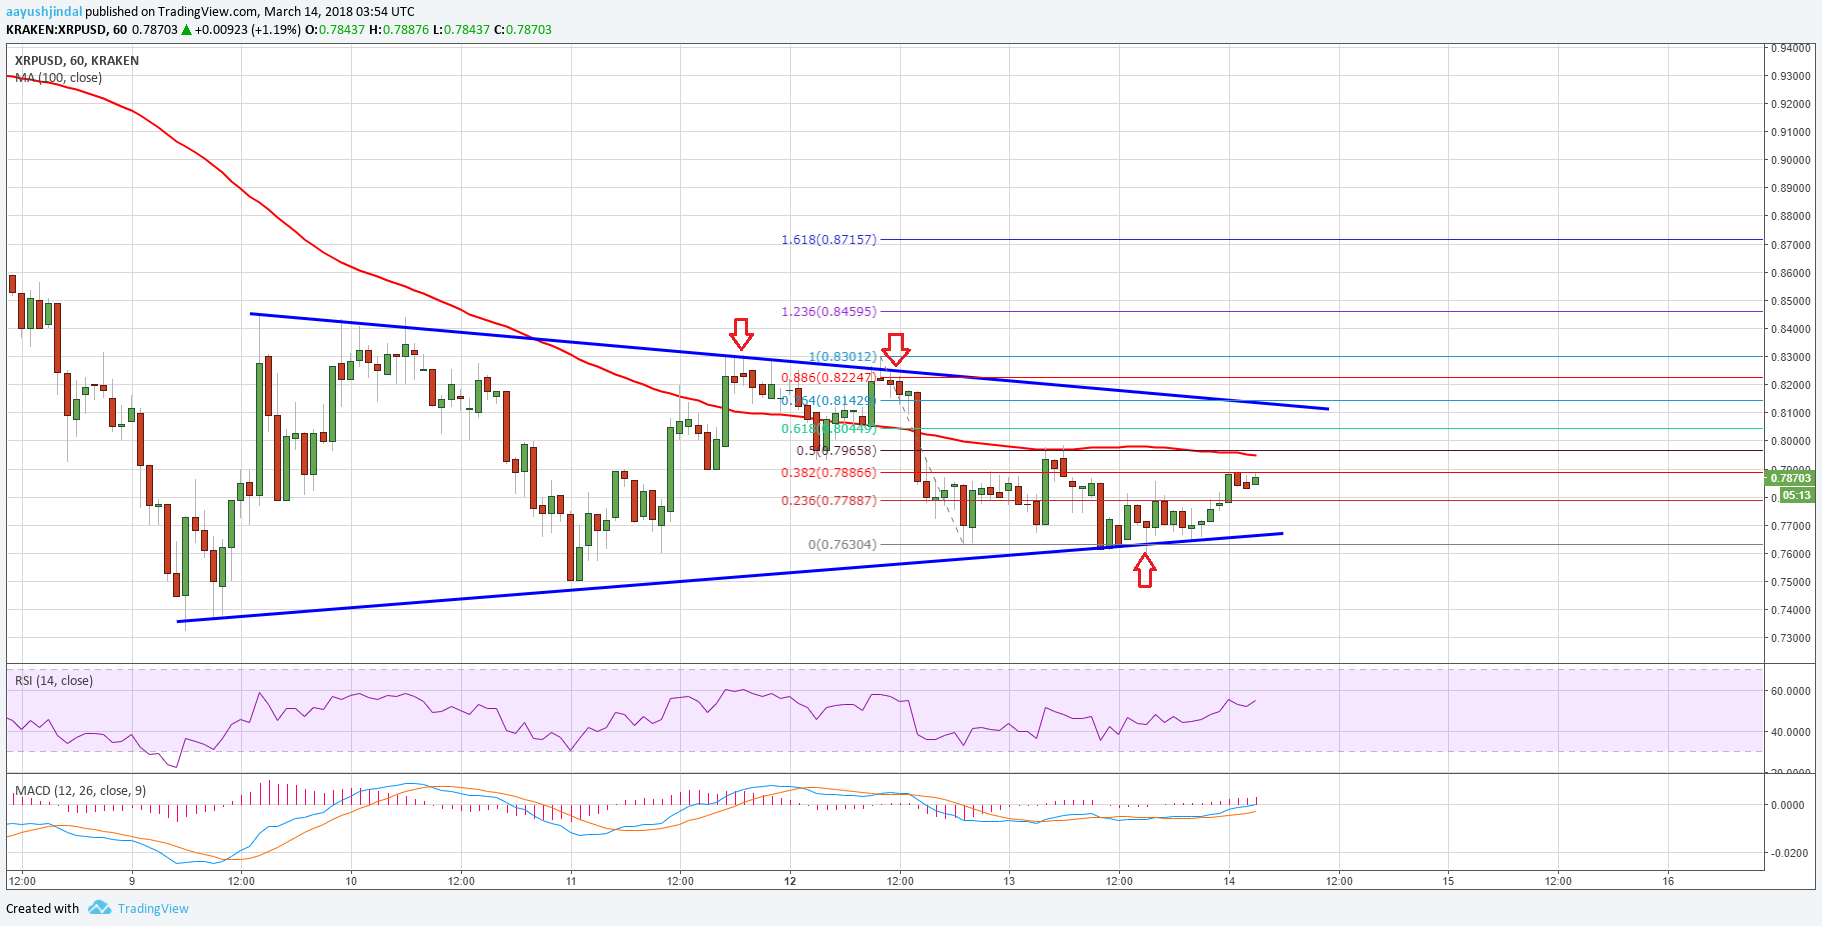
- Yesterday’s highlighted monster contracting triangle pattern with current support near $0.7700 is intact on the hourly chart of the XRP/USD pair (data source from Kraken).
- The pair seems to be struggling to gain momentum above $0.8000 and the 100 hourly simple moving average.
Ripple price continues to trade in a range against the US Dollar and Bitcoin. XRP/USD may rise, but it could struggle to break the $0.8000 and $0.8200 resistances.
Ripple Price Range
There was no upside action above $0.8000 in Ripple price against the US Dollar. The price is currently trading in a range and is preparing for the next move above $0.8000. The recent low was formed at $0.7630 form where the price started rising slowly. It is currently trading near the 38.2% Fib retracement level of the last drop from the $0.8300 high to $0.7630 swing low.
However, there are many barriers on the upside around the $0.8000 and $0.8200 levels. First, the 50% Fib retracement level of the last drop from the $0.8300 high to $0.7630 swing low is near $0.8000. Moreover, the stated $0.8000 is just around the 100 hourly simple moving average. Therefore, the $0.8000 level is a major resistance. A break above the stated $0.8000 resistance could clear the way for more gains. More importantly, yesterday’s highlighted monster contracting triangle pattern with current support near $0.7700 is intact on the hourly chart of the XRP/USD pair.
It seems like the pair may continue to trade in a range above $0.7700 for a few sessions. Once there is a break above $0.8000 and $0.8200, there could an extended upside move towards $0.8500.
Looking at the technical indicators:
Hourly MACD – The MACD for XRP/USD is placed nicely in the bullish zone.
Hourly RSI (Relative Strength Index) – The RSI for XRP/USD is moving higher towards the 65 level.
Major Support Level – $0.7700
Major Resistance Level – $0.8200
Charts courtesy – Trading View


