
Reason to trust
How Our News is Made
Strict editorial policy that focuses on accuracy, relevance, and impartiality
Ad discliamer
Morbi pretium leo et nisl aliquam mollis. Quisque arcu lorem, ultricies quis pellentesque nec, ullamcorper eu odio.
Key Highlights
- Ripple price struggled to gain momentum above $1.15 and declined sharply against the US dollar.
- There is a crucial bearish trend line forming with current resistance at $1.02 on the hourly chart of the XRP/USD pair (data source from SimpleFx).
- The pair is currently trading well below the $1.00 support and it remains at a risk of more declines.
Ripple price is under a lot of bearish pressure against the US Dollar and Bitcoin. XRP/USD could decline further towards $0.9000 as long as it is below $1.00.
Ripple Price Decline
There was no increase in buying sentiment for Ripple price above the $1.10 level against the US Dollar. The price failed to gain momentum and declined below the $1.05 and $1.00 support levels. It even broke the $0.98 support and is currently well below the 100 hourly simple moving average. The recent was formed near $0.9268 from where an upside correction was initiated.
XRP moved above the 23.6% Fib retracement level of the last decline from the $1.0811 high to $0.9268 low. However, the upside move was contained by the $0.9850 level. Moreover, the 38.2% Fib retracement level of the last decline from the $1.0811 high to $0.9268 low also acted as a resistance. To the topside, there is a crucial bearish trend line forming with current resistance at $1.02 on the hourly chart of the XRP/USD pair. Another important resistance is at $1.00 and the 50% Fib retracement level of the last decline from the $1.0811 high to $0.9268 low.
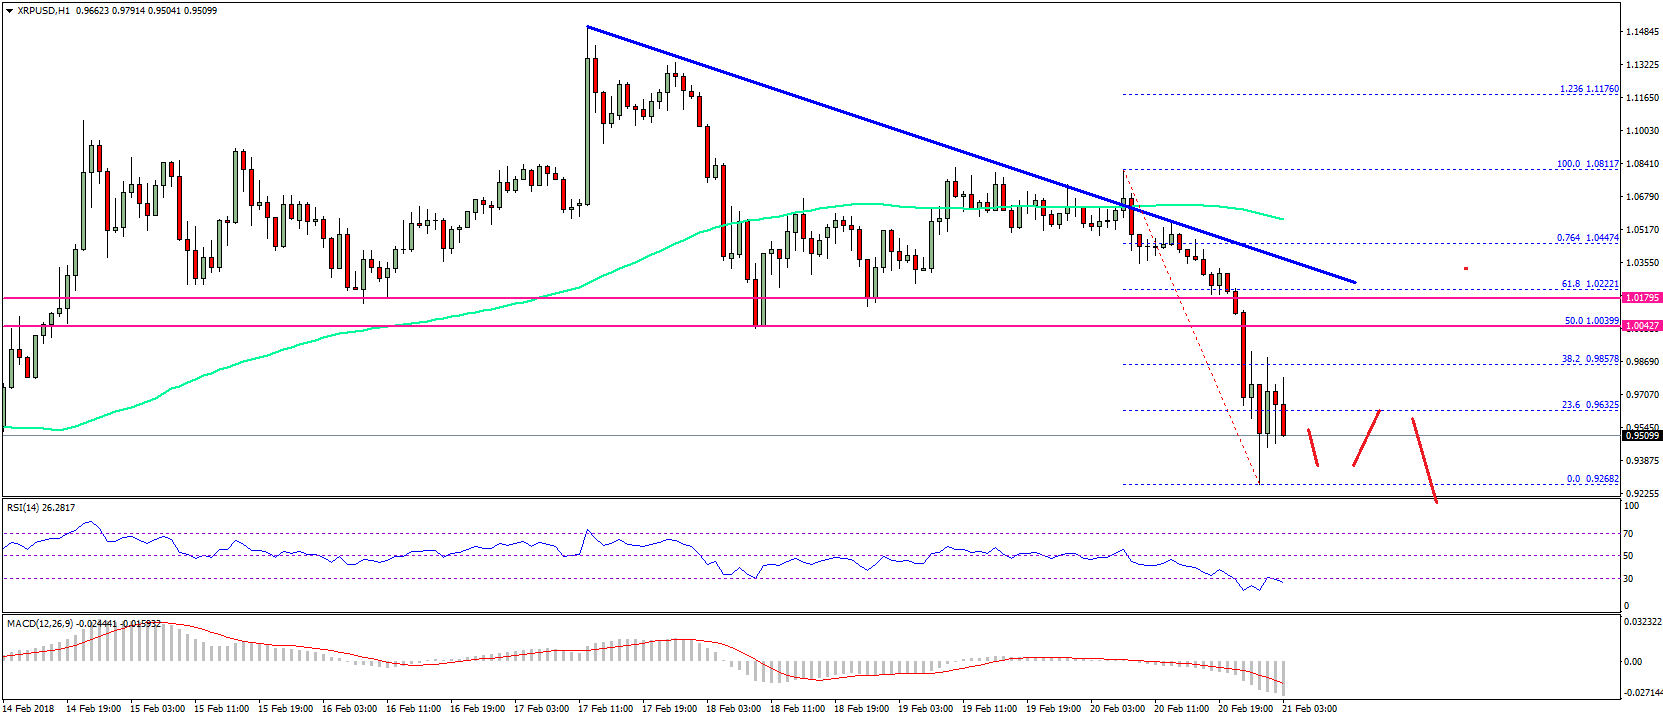
Therefore, there are many resistances on the upside near the $1.00 and $1.02 levels. On the downside, the price may find support near $0.9500, but overall it remains at a risk of more declines.
Looking at the technical indicators:
Hourly MACD – The MACD for XRP/USD is placed strongly in the bearish zone.
Hourly RSI (Relative Strength Index) – The RSI for XRP/USD is moving further lower in the oversold levels.
Major Support Level – $0.9500
Major Resistance Level – $1.0000
Charts courtesy – SimpleFX


