
Reason to trust
How Our News is Made
Strict editorial policy that focuses on accuracy, relevance, and impartiality
Ad discliamer
Morbi pretium leo et nisl aliquam mollis. Quisque arcu lorem, ultricies quis pellentesque nec, ullamcorper eu odio.
Key Highlights
- Ripple price fell sharply and declined below the $0.8500 and $0.8200 support levels against the US dollar.
- There is a major bearish trend line forming with resistance near $0.8600 on the hourly chart of the XRP/USD pair (data source from Kraken).
- The pair remains in a bearish zone and it may decline further towards $0.7800 in the near term.
Ripple price fell sharply against the US Dollar and Bitcoin. XRP/USD is now well below $0.8500 and it looks set for more losses in the short term.
Ripple Price Decline
There was a sharp downside reaction from the $0.9200 swing high in Ripple price against the US Dollar. The price declined and broke a major support area near $0.8500. It ignited further declines and the price even traded below the $0.8000 level before recovering. It is now trading well below the $0.9000 resistance and the 100 hourly simple moving average.
Recently, the price traded as low as $0.7877 before it recovered. It moved above the 50% Fib retracement level of the last drop from the $0.9236 high to $0.7877 low. However, the upside move was protected by the $0.8870 level. Moreover, there was close above the 61.8% Fib retracement level of the last drop from the $0.9236 high to $0.7877 low. It seems like the price failed to move above the maintain gains above the $0.8600 level. On the upside, there is a major bearish trend line forming with resistance near $0.8600 on the hourly chart of the XRP/USD pair.
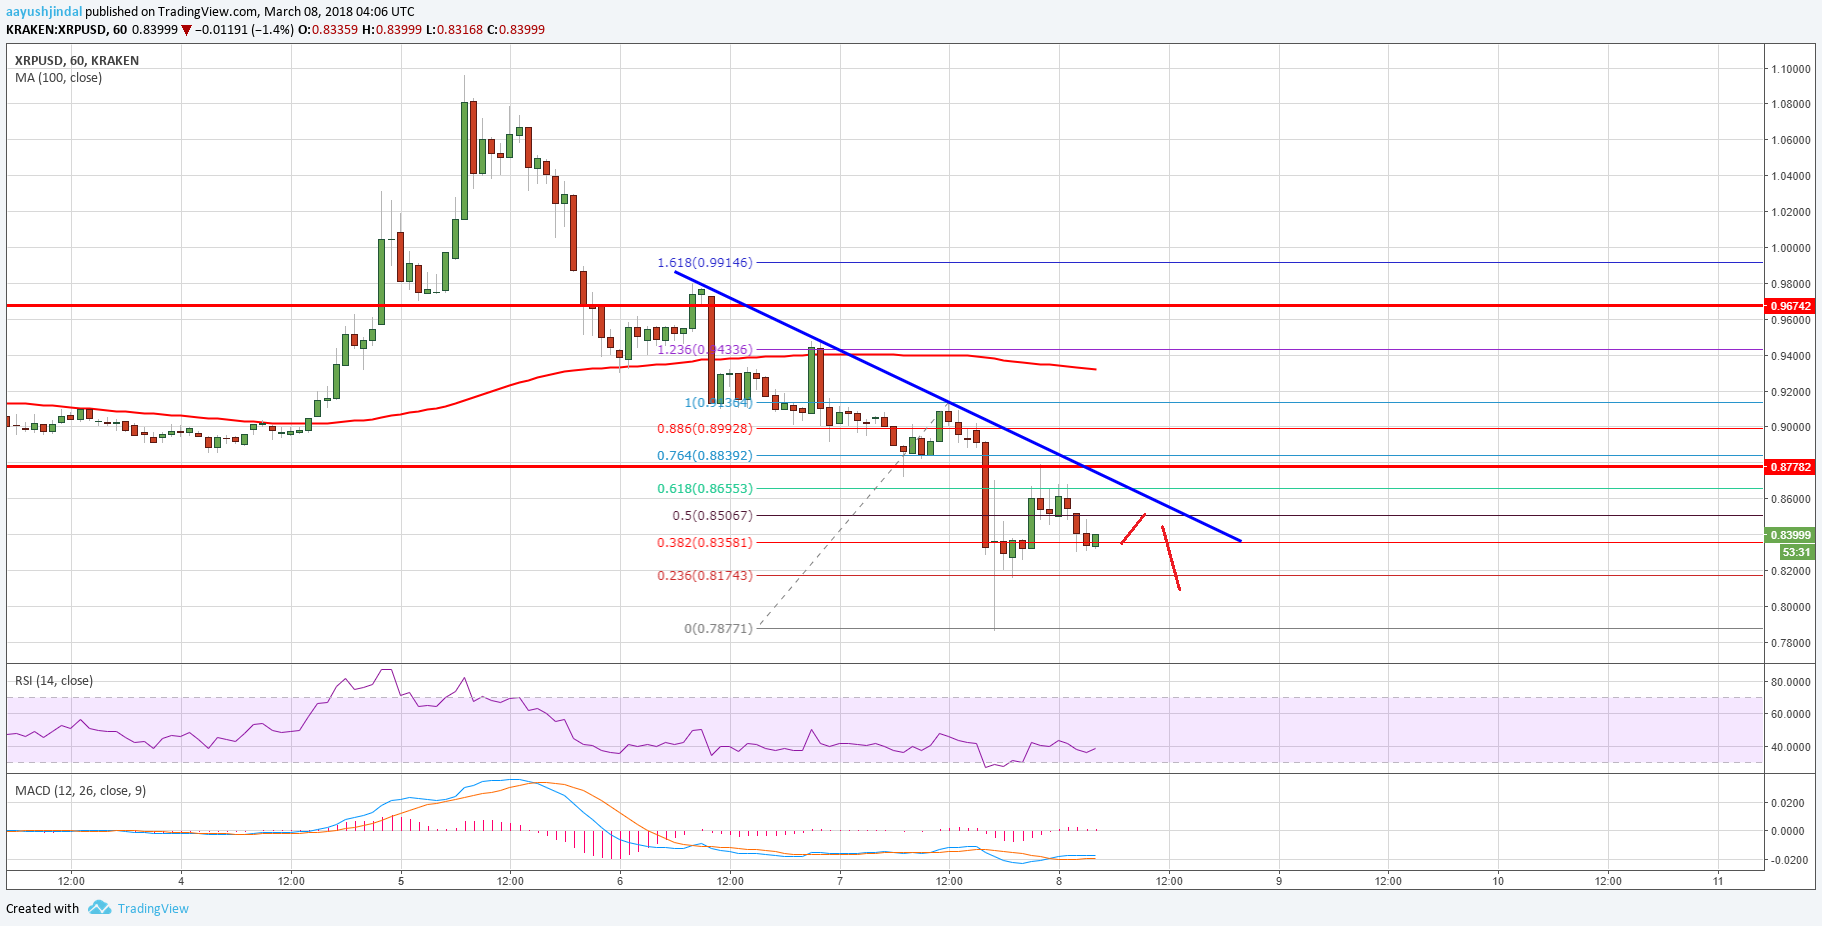
Therefore, a major recovery above $0.8600 won’t be easy. On the downside, the $0.8000 level is a decent support. Below the mentioned $0.8000, the price may retest the $0.7800 level in the near term.
Looking at the technical indicators:
Hourly MACD – The MACD for XRP/USD is slightly in the bullish zone.
Hourly RSI (Relative Strength Index) – The RSI for XRP/USD is currently recovering from the 30 level.
Major Support Level – $0.8000
Major Resistance Level – $0.8600
Charts courtesy – Trading View


0.7291 is the next support from where it currently is. if it breaks that then 0.57 is next. Currently 0.80641