
Reason to trust
How Our News is Made
Strict editorial policy that focuses on accuracy, relevance, and impartiality
Ad discliamer
Morbi pretium leo et nisl aliquam mollis. Quisque arcu lorem, ultricies quis pellentesque nec, ullamcorper eu odio.
Key Highlights
- Ripple price accelerated declined and broke the $0.6000 and $0.5800 support levels against the US dollar.
- There is a short-term bearish trend line forming with resistance at $0.5800 on the hourly chart of the XRP/USD pair (data source from Kraken).
- The pair remains at a risk more losses below the $0.5600 and $0.5500 support levels.
Ripple price is in a bearish trend against the US Dollar and Bitcoin. XRP/USD is struggling to hold ground and it could decline further towards $0.5400.
Ripple Price Bearish Trend
There was no recovery in Ripple price above the $0.6400 and $0.6500 resistance levels against the US Dollar. The price declined further and it broke a major support at $0.6150. It opened the doors for more losses and the price declined below the $0.6000 and $0.5800 support levels. Clearly, the price is in a bearish trend and is currently trading well below the $0.6000 level and the 100 hourly simple moving average.
The recent low was formed at $0.5595 and it seems like the price may even struggle to correct higher. An initial resistance is around the 23.6% Fib retracement level of the last decline from the $0.6561 high to $0.5595 low. There is also a short-term bearish trend line forming with resistance at $0.5800 on the hourly chart of the XRP/USD pair. If buyers succeed in pushing the price above $0.5800, the next resistance is at $0.6000. Moreover, the 50% Fib retracement level of the last decline from the $0.6561 high to $0.5595 low is at $0.6078 to act as the next hurdle.
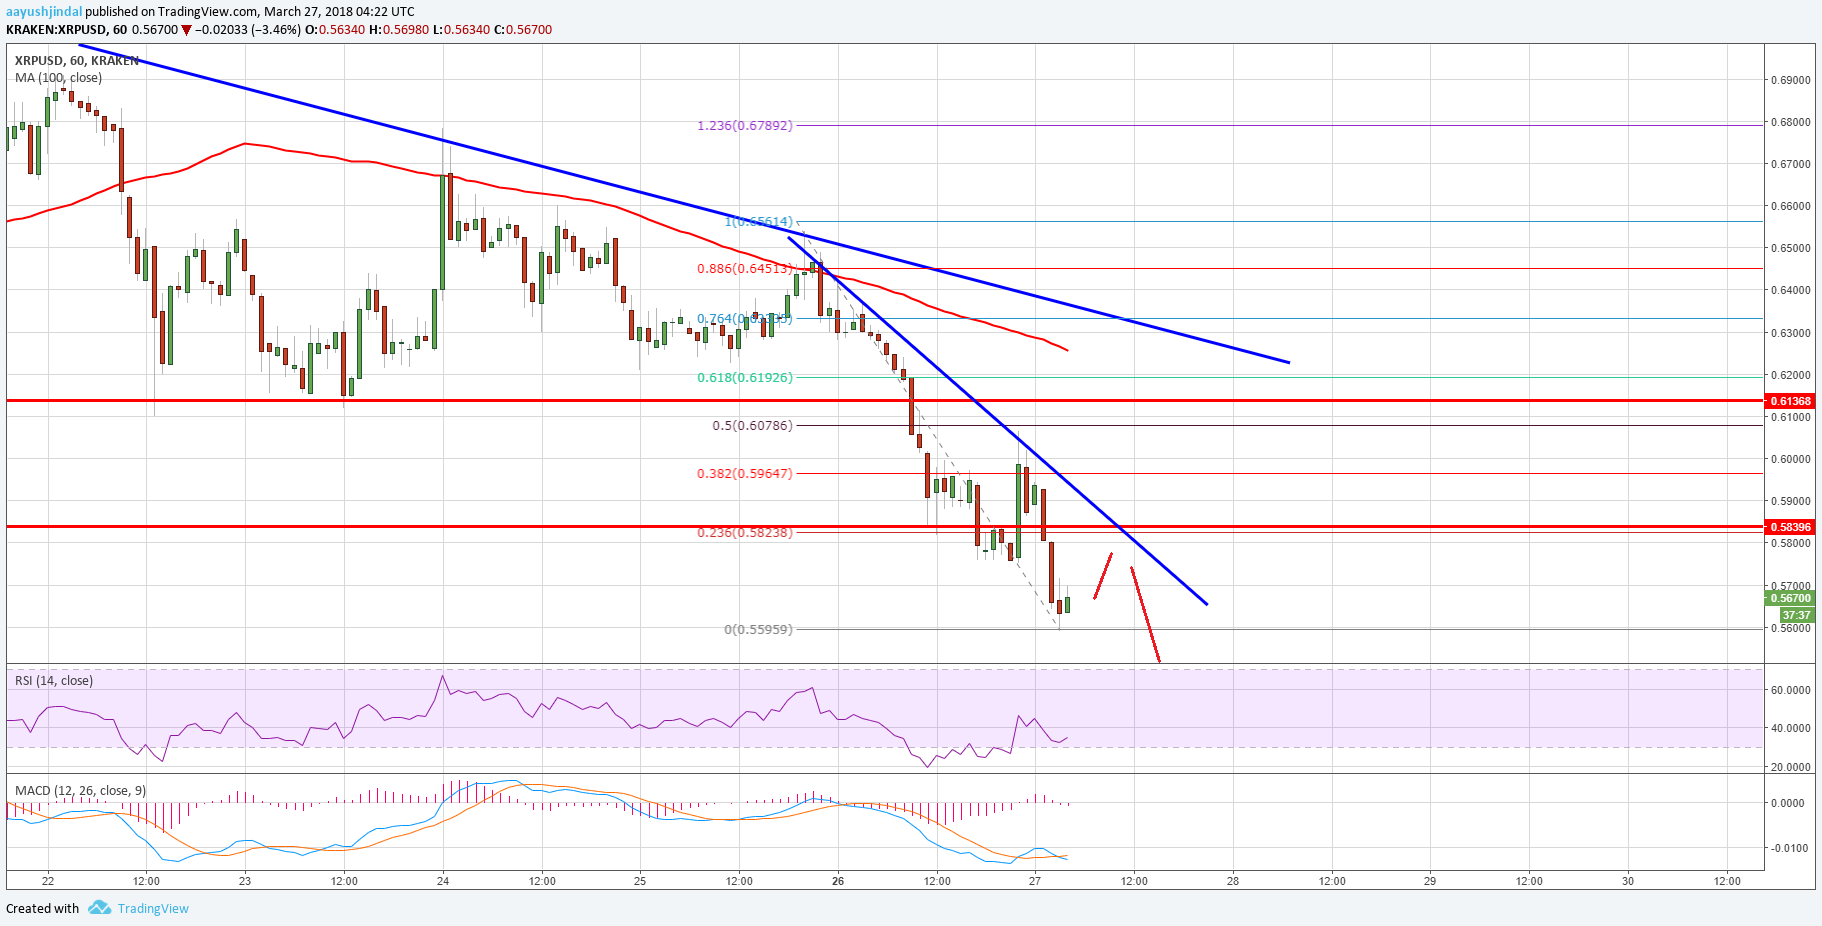
On the downside, the recent low of $0.5595 remains at a risk. A break below $0.5595 may call for more losses below $0.5500 in the near term.
Looking at the technical indicators:
Hourly MACD – The MACD for XRP/USD is placed nicely in the bearish zone.
Hourly RSI (Relative Strength Index) – The RSI for XRP/USD is currently around the 25 level.
Major Support Level – $0.5500
Major Resistance Level – $0.6000
Charts courtesy – Trading View


