
Reason to trust
How Our News is Made
Strict editorial policy that focuses on accuracy, relevance, and impartiality
Ad discliamer
Morbi pretium leo et nisl aliquam mollis. Quisque arcu lorem, ultricies quis pellentesque nec, ullamcorper eu odio.
Key Highlights
- Ripple price moved above the $0.7000 resistance and is currently consolidating gains against the US dollar.
- There is a short-term connecting bearish trend line forming with resistance at $0.7065 on the hourly chart of the XRP/USD pair (data source from SimpleFx).
- The pair may soon break the $0.7065 resistance and the 100 hourly simple moving average to gain momentum.
Ripple price is trading nicely with positive signs against the US Dollar and Bitcoin. XRP/USD is likely to move above $0.7500 in the near term once the current consolidation is over.
Ripple Price Trend
There was a decent start of an upside move from $0.5500 in Ripple price yesterday against the US Dollar. The price climbed higher and succeeded in breaking the $0.7000 resistance. The upside move was strong since the price settled above the $0.6500 pivot level. There was also break above the 50% Fib retracement level of the last drop from the $0.9675 high to $0.5178 low.
More importantly, there was a break above a crucial bearish trend line at $0.6800 on the hourly chart of the XRP/USD pair. The pair traded as high as $0.7649 and is currently correcting lower. It is currently below the 0.7000 level and the 100 hourly simple moving average. During the slide, the pair tested the 23.6% Fib retracement level of the last wave from the $0.5180 low to $0.7649 high. However, the broken trend line acted as a support near the $0.6500 level.
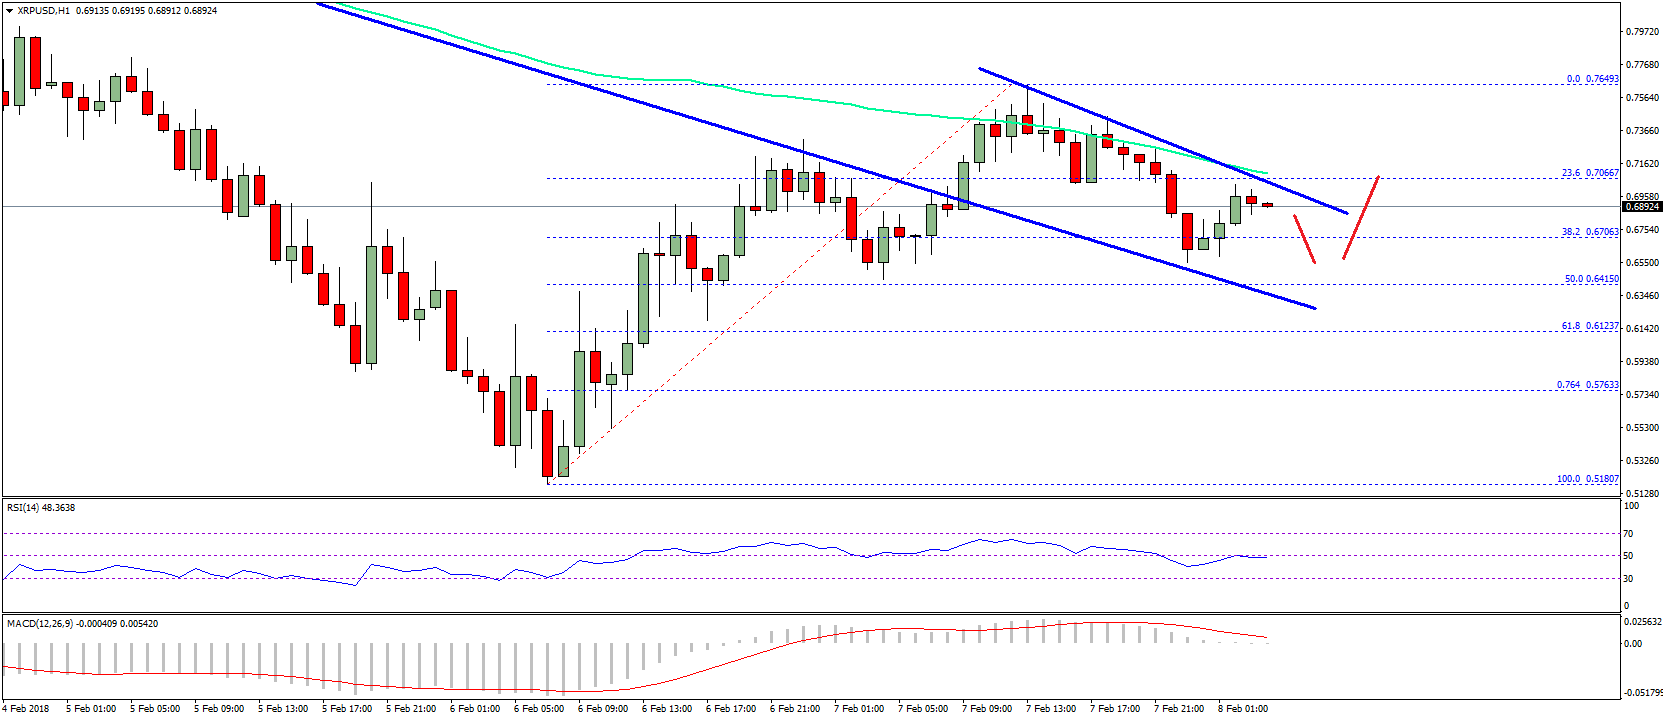
On the upside, there is a short-term connecting bearish trend line forming with resistance at $0.7065 on the same chart. XRP buyers need to break the trend line resistance at $0.7065 and the 100 hourly simple moving average to gain momentum.
Looking at the technical indicators:
Hourly MACD – The MACD for XRP/USD is struggling to gain momentum in the bullish zone.
Hourly RSI (Relative Strength Index) – The RSI for XRP/USD is just around the 50 level.
Major Support Level – $0.6500
Major Resistance Level – $0.7065
Charts courtesy – SimpleFX


Thanks for the analysis