
Reason to trust
How Our News is Made
Strict editorial policy that focuses on accuracy, relevance, and impartiality
Ad discliamer
Morbi pretium leo et nisl aliquam mollis. Quisque arcu lorem, ultricies quis pellentesque nec, ullamcorper eu odio.
Key Highlights
- Ripple price remained in a tiny range and managed to hold the $0.4700 support against the US dollar.
- There is a short-term connecting bullish trend line forming with support at $0.4800 on the hourly chart of the XRP/USD pair (data source from Kraken).
- The pair has to move above the $0.5000 resistance level to gain upside momentum in the near term.
Ripple price is under a lot of pressure against the US Dollar and Bitcoin. XRP/USD must stay above the $0.4700 support to avoid any further losses in the near term.
Ripple Price Range
There was no recovery during the past few sessions above $0.5000 in Ripple price against the US Dollar. There were mostly bearish moves below the $0.5000 resistance and the 100 hourly simple moving average. On the positive note, the price managed to hold a major support area near $0.4700. At the moment, the price is consolidating losses above the $0.4800 and $0.4700 support levels.
The recent low was formed at $0.4754 before the price started trading in a range. It moved slightly higher and tested the 23.6% Fib retracement level of the last drop from the $0.5540 high to $0.4754 low. However, the most important barrier for a recovery sits near the $0.5000 resistance and the 100 hourly simple moving average. Moreover, the 38.2% Fib retracement level of the last drop from the $0.5540 high to $0.4754 low is at $0.5050. Therefore, the price may perhaps face a strong resistance near the $0.5000-0.5050 area.
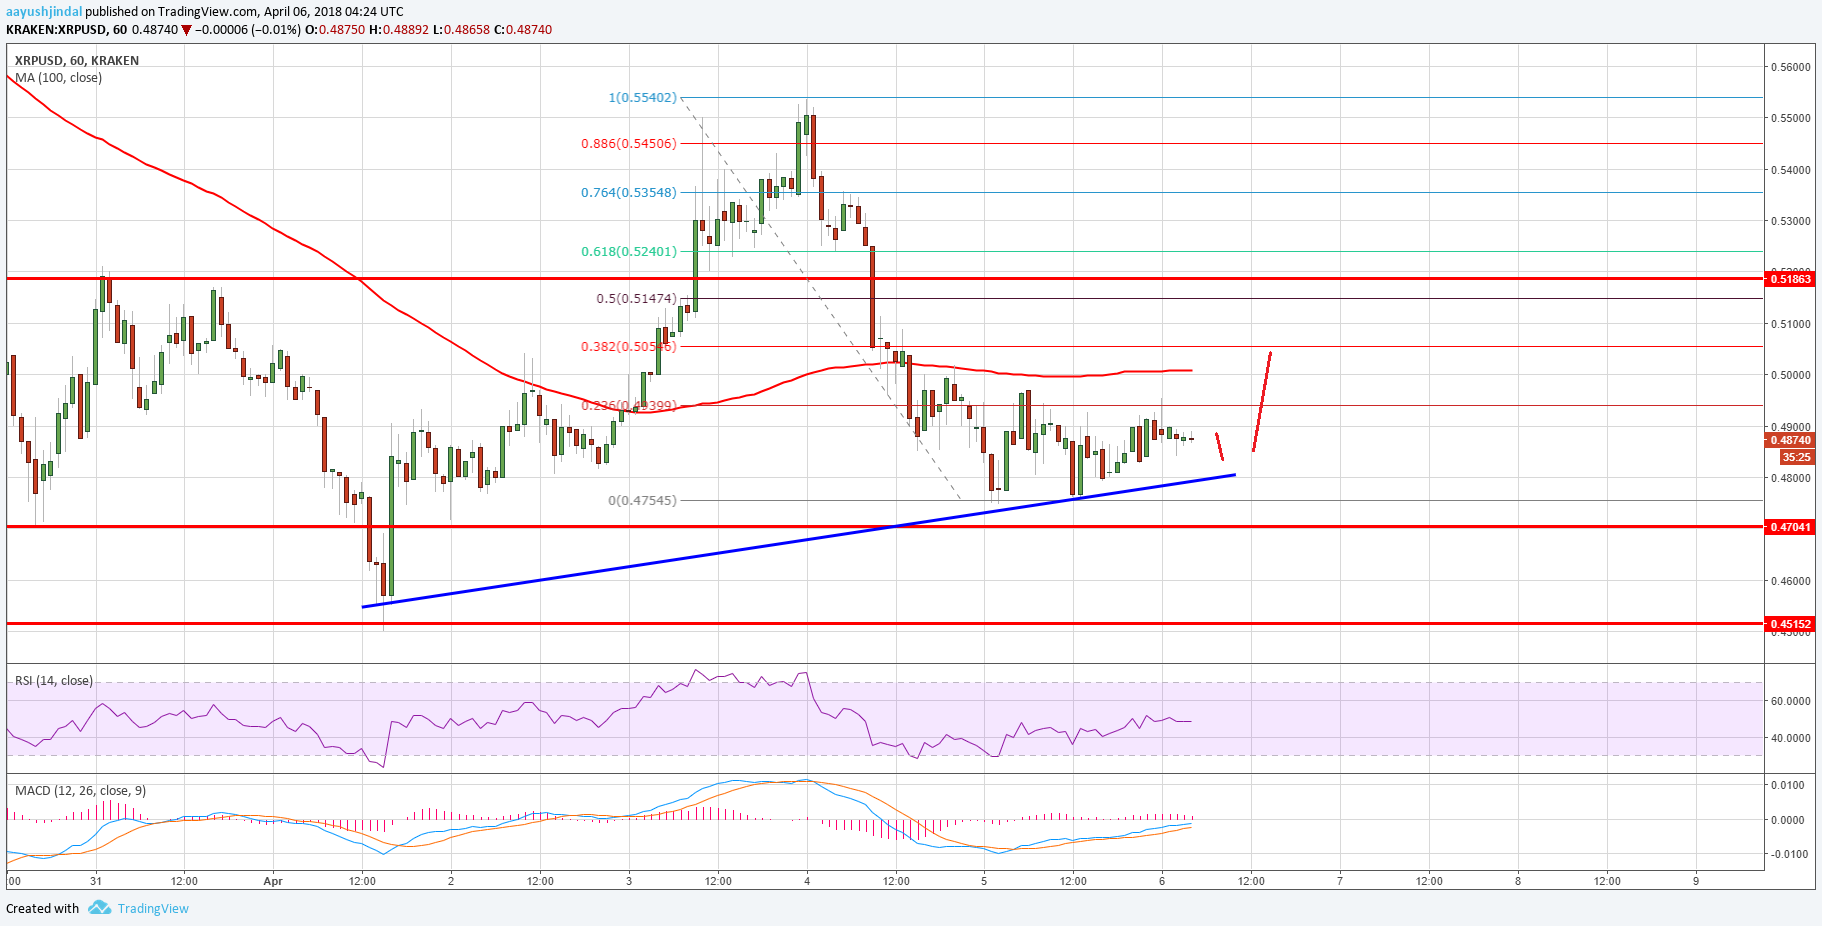
On the downside, there is a short-term connecting bullish trend line forming with support at $0.4800 on the hourly chart of the XRP/USD pair. The pair must stay above the $0.4700 and $0.4800 support levels to avoid further downsides in the near term.
Looking at the technical indicators:
Hourly MACD – The MACD for XRP/USD is slowly moving in the bullish zone.
Hourly RSI (Relative Strength Index) – The RSI for XRP/USD is flat near the 45 level.
Major Support Level – $0.4700
Major Resistance Level – $0.5000
Charts courtesy – Trading View


