
Reason to trust
How Our News is Made
Strict editorial policy that focuses on accuracy, relevance, and impartiality
Ad discliamer
Morbi pretium leo et nisl aliquam mollis. Quisque arcu lorem, ultricies quis pellentesque nec, ullamcorper eu odio.
Key Highlights
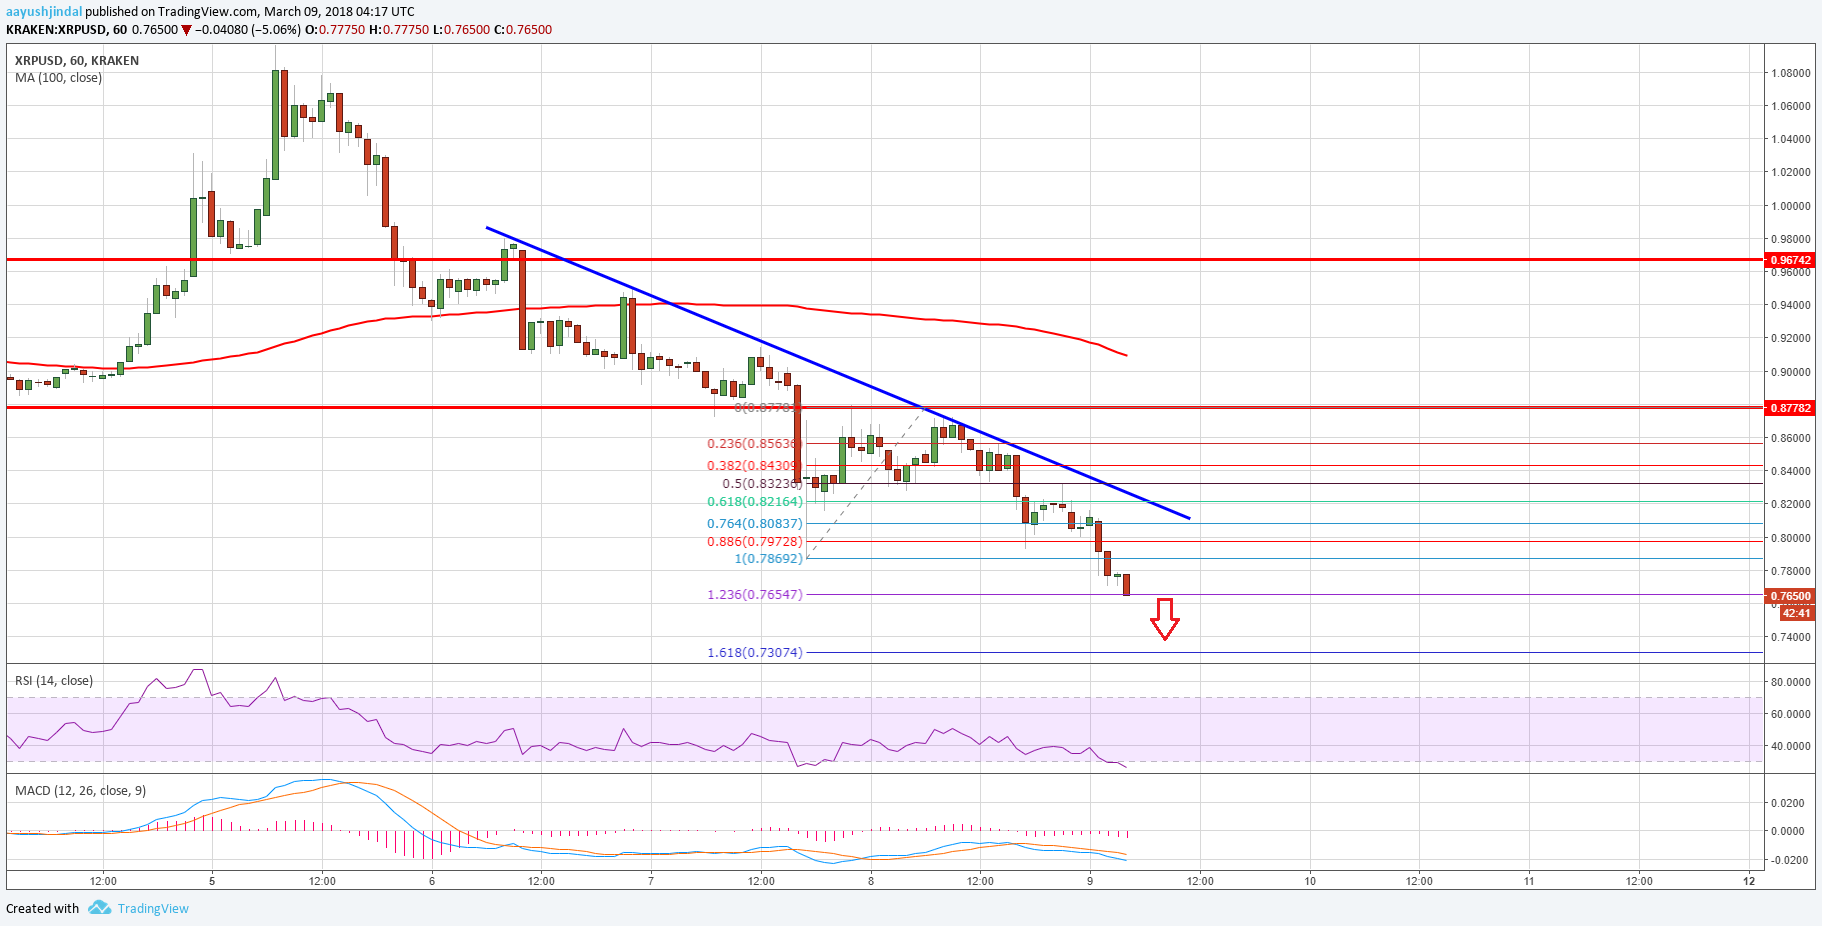
- Ripple price declined sharply and even broke the $0.8200 and $0.8000 support levels against the US dollar.
- Yesterday’s highlighted crucial bearish trend line with current resistance at $0.0.8000 is intact on the hourly chart of the XRP/USD pair (data source from Kraken).
- The pair is likely to decline further and it may even break the $0.7650 support in the near term.
Ripple price declined heavily against the US Dollar and Bitcoin. XRP/USD is currently trading below $0.8000 and it may continue to decline towards $0.7200.
Ripple Price Downtrend
There was no respite above $0.8500 in Ripple price against the US Dollar. The price continued to trade lower and it failed to correct above a major resistance near $0.8600. It fell and broke the $0.8200 and $0.8000 support levels to set the pace for more declines. It even broke the last swing low of $0.7869, which is a bearish sign and suggests more declines in the near term.
At the moment, the price is trading near the 1.236 Fib extension of the last wave from the $0.7869 low to $0.8778 high. It could continue to decline and it may even break the $0.7500 level. The next major support on the downside is around $0.7300. The stated level also coincides with the 1.618 Fib extension of the last wave from the $0.7869 low to $0.8778 high. On the upside, there are many resistances around the $0.8000 level. Moreover, yesterday’s highlighted crucial bearish trend line with current resistance at $0.0.8000 is intact on the hourly chart of the XRP/USD pair.
Overall, it seems like the price may continue to decline towards $0.7300. A break and close below $0.7300 may call for a call of $0.7000.
Looking at the technical indicators:
Hourly MACD – The MACD for XRP/USD is currently in the bearish zone.
Hourly RSI (Relative Strength Index) – The RSI for XRP/USD is moving lower further into the oversold levels.
Major Support Level – $0.7300
Major Resistance Level – $0.8000
Charts courtesy – Trading View


What is the point in further “analyzing” cryptocurrencies? The bubble burst. Get over it.