
Reason to trust
How Our News is Made
Strict editorial policy that focuses on accuracy, relevance, and impartiality
Ad discliamer
Morbi pretium leo et nisl aliquam mollis. Quisque arcu lorem, ultricies quis pellentesque nec, ullamcorper eu odio.
Key Highlights
- Ripple price after a major decline, found support near $0.55 and recovered against the US dollar.
- There was a break above a key bearish trend line with resistance at $0.6200 on the hourly chart of the XRP/USD pair (data source from Kraken).
- The pair may rise further, but it has to break and settle above the $0.70 resistance and the 100 hourly simple moving average.
Ripple price is showing a few positive signs against the US Dollar and Bitcoin. XRP/USD must break the $0.70 resistance to gain further upside momentum.
Ripple Price Support
There were nasty declines this past week in Ripple price from the $0.8000 pivot level against the US Dollar. The price tumbled and moved below the $0.7000 and $0.6000 support levels. It traded towards the $0.5000 level and formed a low at $0.5341 before starting an upside move. It corrected higher and managed to move above the $0.5800 and $0.6000 resistance levels.
The upside move was positive as the price was even able to surpass the $0.6200 barrier. Moreover, there was a break above a key bearish trend line with resistance at $0.6200 on the hourly chart of the XRP/USD pair. The pair traded as high as $0.6868 and is currently trading near the 100 hourly simple moving average. It is slowly correcting lower and is testing the 23.6% Fib retracement level of the last wave from the $0.5341 low to $0.6868 high. It may correct a few more points, but it could find support near $0.6250.
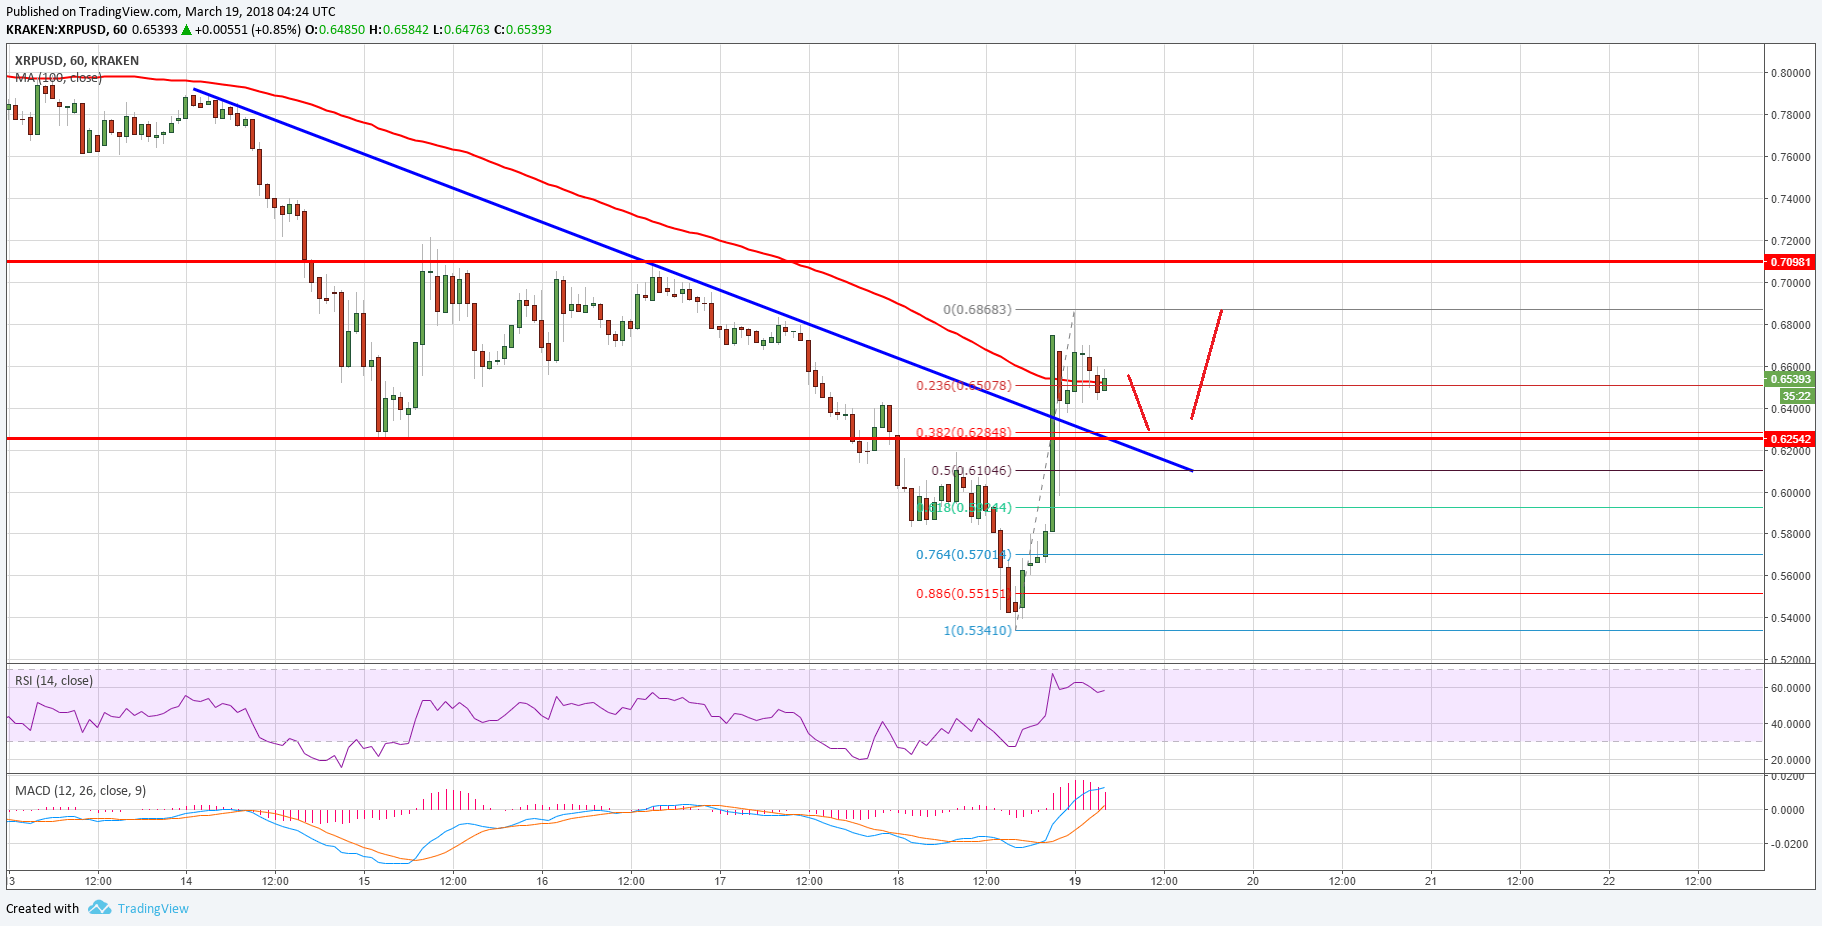
The mentioned $0.6250 support is near the 38.2% Fib retracement level of the last wave from the $0.5341 low to $0.6868 high. On the upside, the price has to move above the $0.6800 and $0.7000 resistance levels to gain upside momentum.
Looking at the technical indicators:
Hourly MACD – The MACD for XRP/USD is currently in the bullish zone.
Hourly RSI (Relative Strength Index) – The RSI for XRP/USD is now near the 60 level.
Major Support Level – $0.6250
Major Resistance Level – $0.7000
Charts courtesy – Trading View


Thanks for the update.