
Reason to trust
How Our News is Made
Strict editorial policy that focuses on accuracy, relevance, and impartiality
Ad discliamer
Morbi pretium leo et nisl aliquam mollis. Quisque arcu lorem, ultricies quis pellentesque nec, ullamcorper eu odio.
Key Highlights
- Ripple price made a nice upside move and broke the $0.2500 resistance against the US Dollar.
- Yesterday’s highlighted contracting triangle with resistance at $0.2400 was broken on the hourly chart of the XRP/USD pair (data source from Kraken).
- The pair is now well above the $0.2550 level and looks set for more gains in the near term.
Ripple price broke key resistances against the US Dollar and Bitcoin. XRP/USD is now above $0.2500 and eyeing further upsides.
Ripple Price Upside Break
There was a good upside reaction in Ripple price recently as it moved above the $0.2350 level against the US Dollar. The upside move was strong as the price was able to move above the $0.2400 and $0.2500 resistance levels. Earlier, there was a minor correction towards 50% Fib retracement level of the last leg from the $0.2050 low to $0.2490 high. However, buyers appeared and pushed the price above $0.2400.
During the upside, yesterday’s highlighted contracting triangle with resistance at $0.2400 was broken on the hourly chart of the XRP/USD pair. The pair recently traded as high as $0.2612 and is currently placed well above the 100 hourly simple moving average. It seems like there can be more gains above $0.2600 in the near term. The next major resistance is around the $0.2800 pivot.
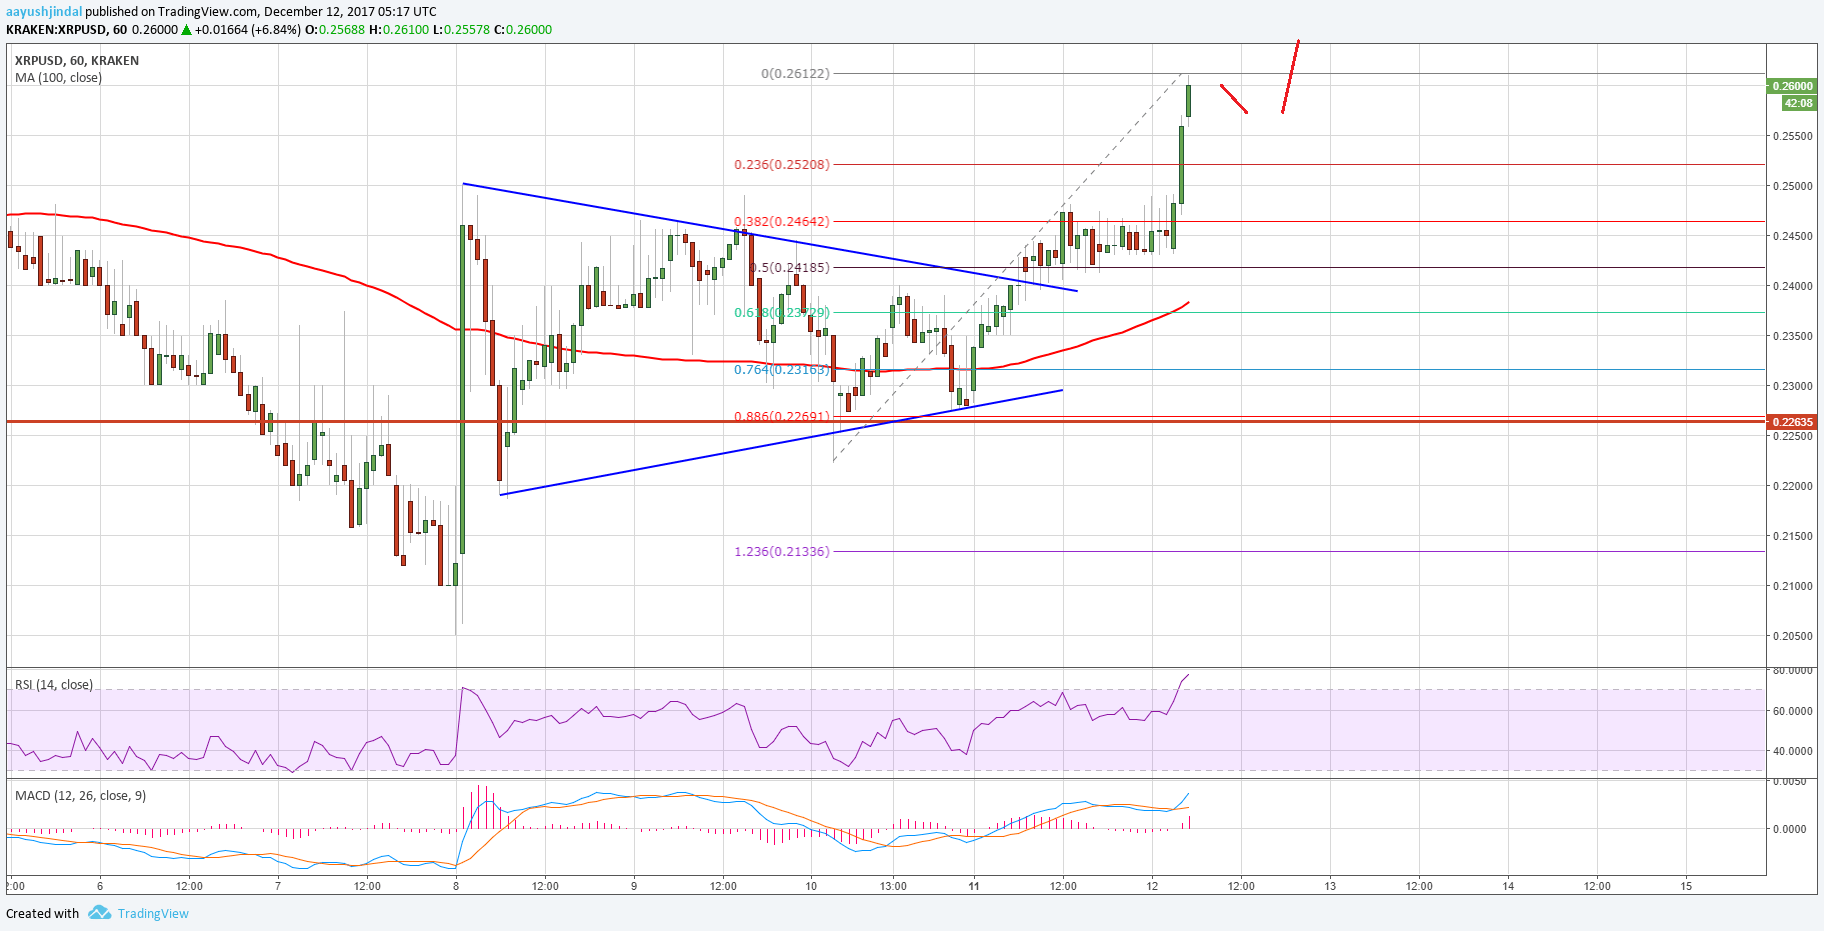
On the downside, an initial support is around the 23.6% Fib retracement level of the last wave from the $0.2230 low to $0.2612 high. However, the most important support is now at $0.2400, which was a resistance earlier. The mentioned $2400 support is also around the 50% Fib retracement level of the last wave from the $0.2230 low to $0.2612 high. Therefore, the price is now well supported above $0.2400 for more gains towards $0.2800.
Looking at the technical indicators:
Hourly MACD – The MACD for XRP/USD is now placed nicely in the bullish zone.
Hourly RSI (Relative Strength Index) – The RSI for XRP/USD has reached the overbought levels.
Major Support Level – $0.2400
Major Resistance Level – $0.2800
Charts courtesy – Trading View, Kraken


