

Key Highlights
- Ripple price formed a key bottom near the $0.4588 and moved higher against the US dollar.
- There is a major bullish trend line forming with support at $0.5000 on the hourly chart of the XRP/USD pair (data source from Kraken).
- The pair may continue to move higher and it could even break the $0.5200 level in the near term.
Ripple price is showing positive signs against the US Dollar and Bitcoin. XRP/USD is currently above $0.5000 and it looks set to break the $0.5200 level.
Ripple Price Support
After a major decline, there was a strong buying interest above the $0.4500 level in Ripple price against the US Dollar. The price formed a key bottom near the $0.4588 and started an upward move. It broke the $0.4800 and $0.5000 resistance levels to set the pace for more gains. During the upside, there was a break above the 38.2% Fib retracement level of the last decline from the $0.5538 high to $0.4588 low.
At the moment, the price is trading well above the $0.5000 level and the 100 hourly simple moving average. However, it is struggling to break the 50% Fib retracement level of the last decline from the $0.5538 high to $0.4588 low at $0.5060-80. A break above the $0.5080 could open the doors for a test of $0.5200. If buyers remain in action, there is even a possibility of a break above the $5200 level. The next hurdle above $0.5200 could be the 76.4% Fib retracement level of the last decline from the $0.5538 high to $0.4588 low.
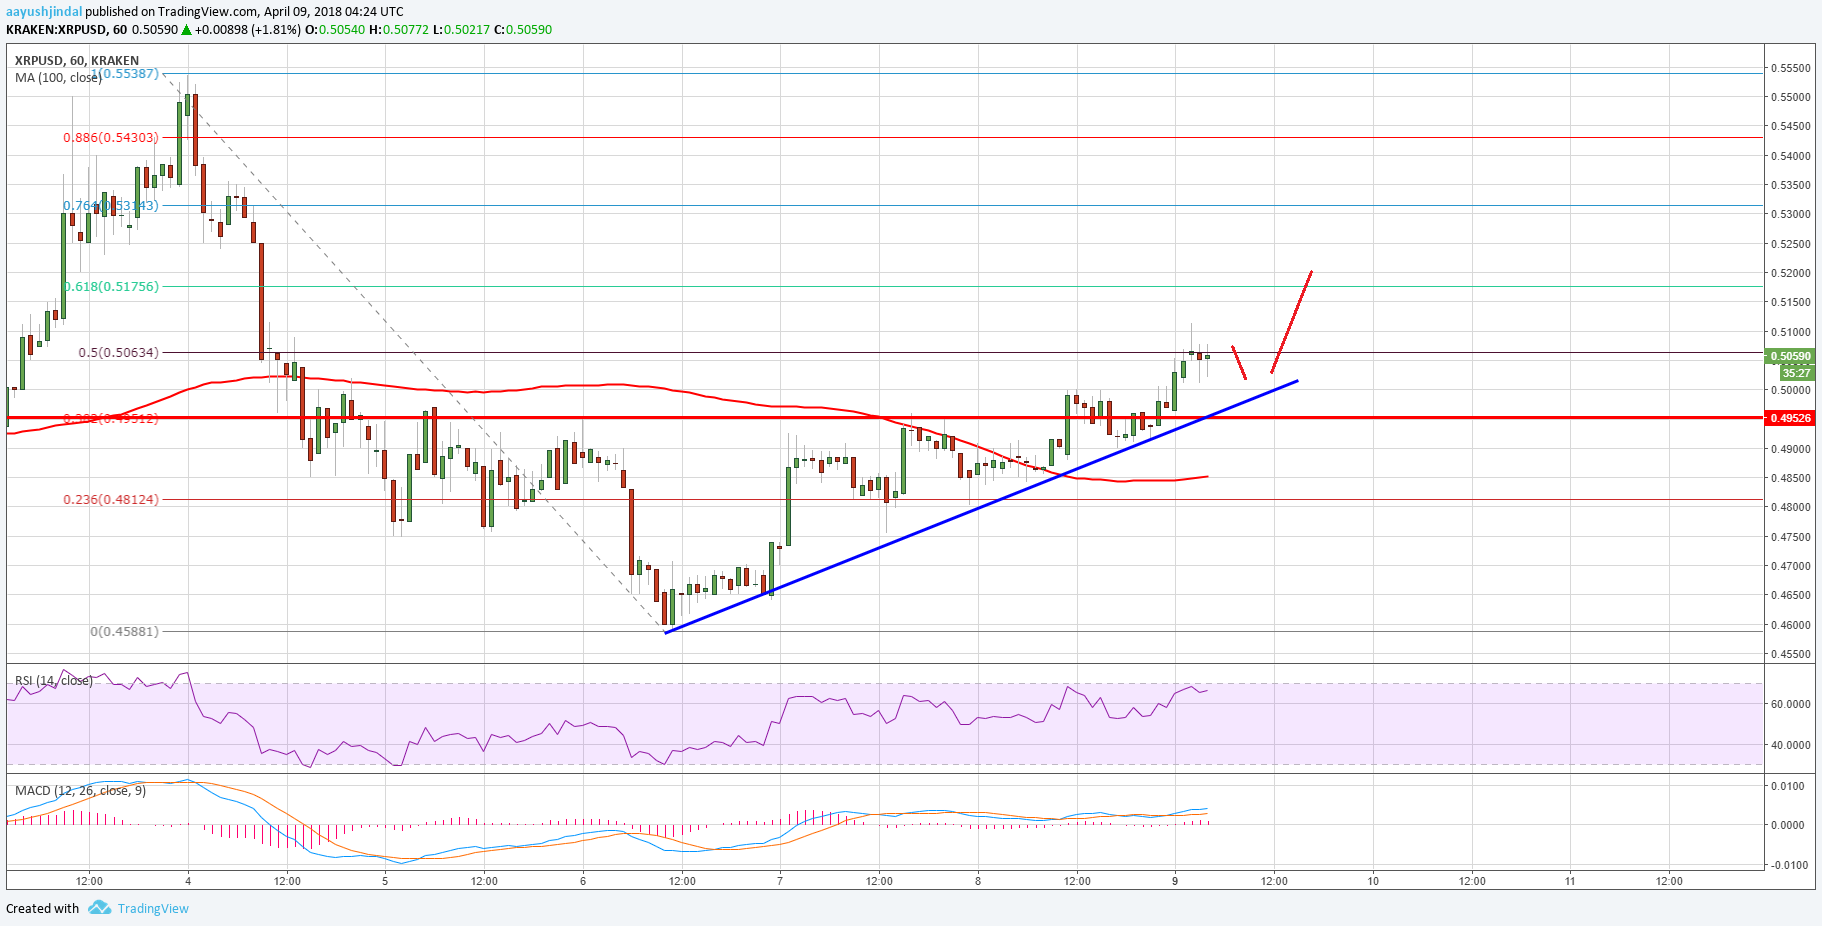

On the downside, there is a major bullish trend line forming with support at $0.5000 on the hourly chart of the XRP/USD pair. Therefore, any dips toward the $0.5000 level remains supported.
Looking at the technical indicators:
Hourly MACD – The MACD for XRP/USD is now placed in the bullish zone.
Hourly RSI (Relative Strength Index) – The RSI for XRP/USD is now well above the 50 level.
Major Support Level – $0.5000
Major Resistance Level – $0.5200
Charts courtesy – Trading View