
Reason to trust
How Our News is Made
Strict editorial policy that focuses on accuracy, relevance, and impartiality
Ad discliamer
Morbi pretium leo et nisl aliquam mollis. Quisque arcu lorem, ultricies quis pellentesque nec, ullamcorper eu odio.
Key Highlights
- Ripple price formed a key bottom near the $0.4588 and moved higher against the US dollar.
- There is a major bullish trend line forming with support at $0.5000 on the hourly chart of the XRP/USD pair (data source from Kraken).
- The pair may continue to move higher and it could even break the $0.5200 level in the near term.
Ripple price is showing positive signs against the US Dollar and Bitcoin. XRP/USD is currently above $0.5000 and it looks set to break the $0.5200 level.
Ripple Price Support
After a major decline, there was a strong buying interest above the $0.4500 level in Ripple price against the US Dollar. The price formed a key bottom near the $0.4588 and started an upward move. It broke the $0.4800 and $0.5000 resistance levels to set the pace for more gains. During the upside, there was a break above the 38.2% Fib retracement level of the last decline from the $0.5538 high to $0.4588 low.
At the moment, the price is trading well above the $0.5000 level and the 100 hourly simple moving average. However, it is struggling to break the 50% Fib retracement level of the last decline from the $0.5538 high to $0.4588 low at $0.5060-80. A break above the $0.5080 could open the doors for a test of $0.5200. If buyers remain in action, there is even a possibility of a break above the $5200 level. The next hurdle above $0.5200 could be the 76.4% Fib retracement level of the last decline from the $0.5538 high to $0.4588 low.
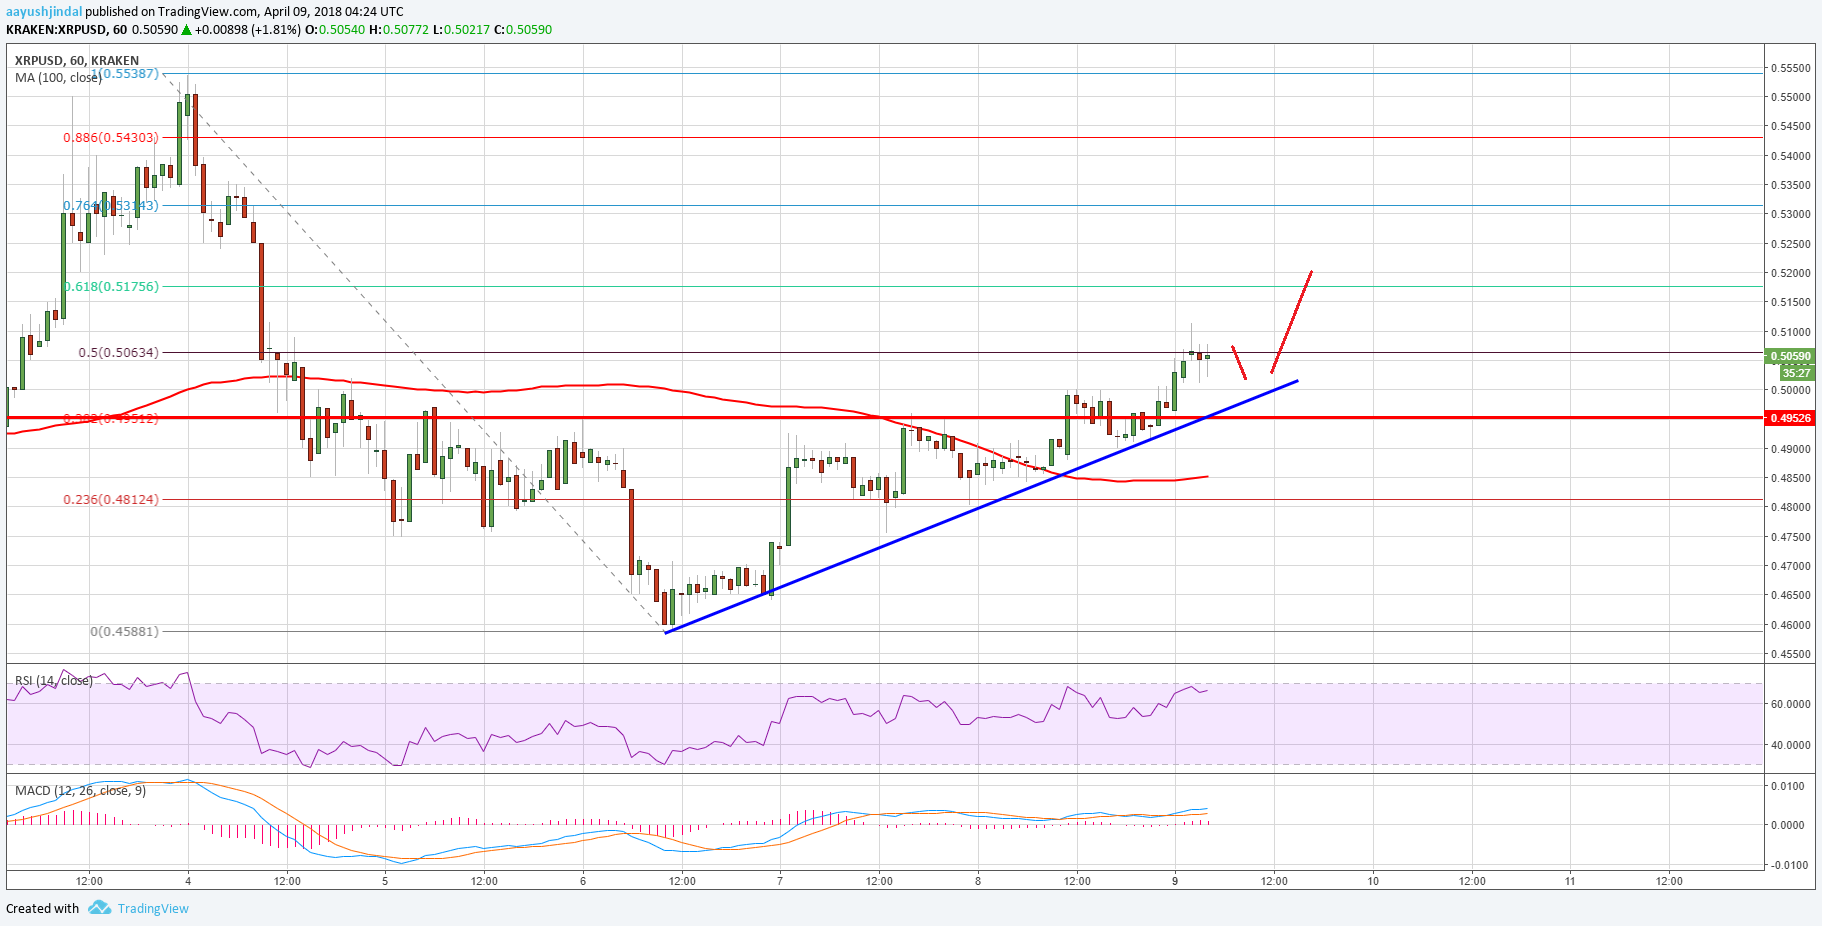
On the downside, there is a major bullish trend line forming with support at $0.5000 on the hourly chart of the XRP/USD pair. Therefore, any dips toward the $0.5000 level remains supported.
Looking at the technical indicators:
Hourly MACD – The MACD for XRP/USD is now placed in the bullish zone.
Hourly RSI (Relative Strength Index) – The RSI for XRP/USD is now well above the 50 level.
Major Support Level – $0.5000
Major Resistance Level – $0.5200
Charts courtesy – Trading View


OK. Stop please.
No please go.
XRP is awesome, so much good news! = price goes down. lol