
Reason to trust
How Our News is Made
Strict editorial policy that focuses on accuracy, relevance, and impartiality
Ad discliamer
Morbi pretium leo et nisl aliquam mollis. Quisque arcu lorem, ultricies quis pellentesque nec, ullamcorper eu odio.
Key Highlights
- Ripple price started a fresh downside wave from $1.3438 and moved below $1.2500 against the US dollar.
- There was a break below a key bullish trend line with support at $1.2150 on the hourly chart of the XRP/USD pair (data source from SimpleFx).
- The pair is currently heading lower and it may soon retest the $1.1250 support area.
Ripple price is currently back in the bearish zone against the US Dollar and Bitcoin. XRP/USD could extend declines towards the $1.1250 and $0.8500 support levels.
Ripple Price Resistance
After a decent recovery above $1.3000, Ripple price faced sellers on the upside against the US Dollar. The price traded as high as $1.3438 and it later started a downside wave. It traded lower and broke the 38.2% Fib retracement level of the last leg from the $1.0595 low to $1.3438 high. It opened the doors for more losses and the price traded below the $1.2500 support and the 100 hourly simple moving average.
During the downside move, there was a break below a key bullish trend line with support at $1.2150 on the hourly chart of the XRP/USD pair. This is a strong bearish sign since the price is now below the 50% Fib retracement level of the last leg from the $1.0595 low to $1.3438 high. It could continue to move down towards the next major support at $1.1250. The mentioned level is near the 76.4% Fib retracement level of the last leg from the $1.0595 low to $1.3438 high.
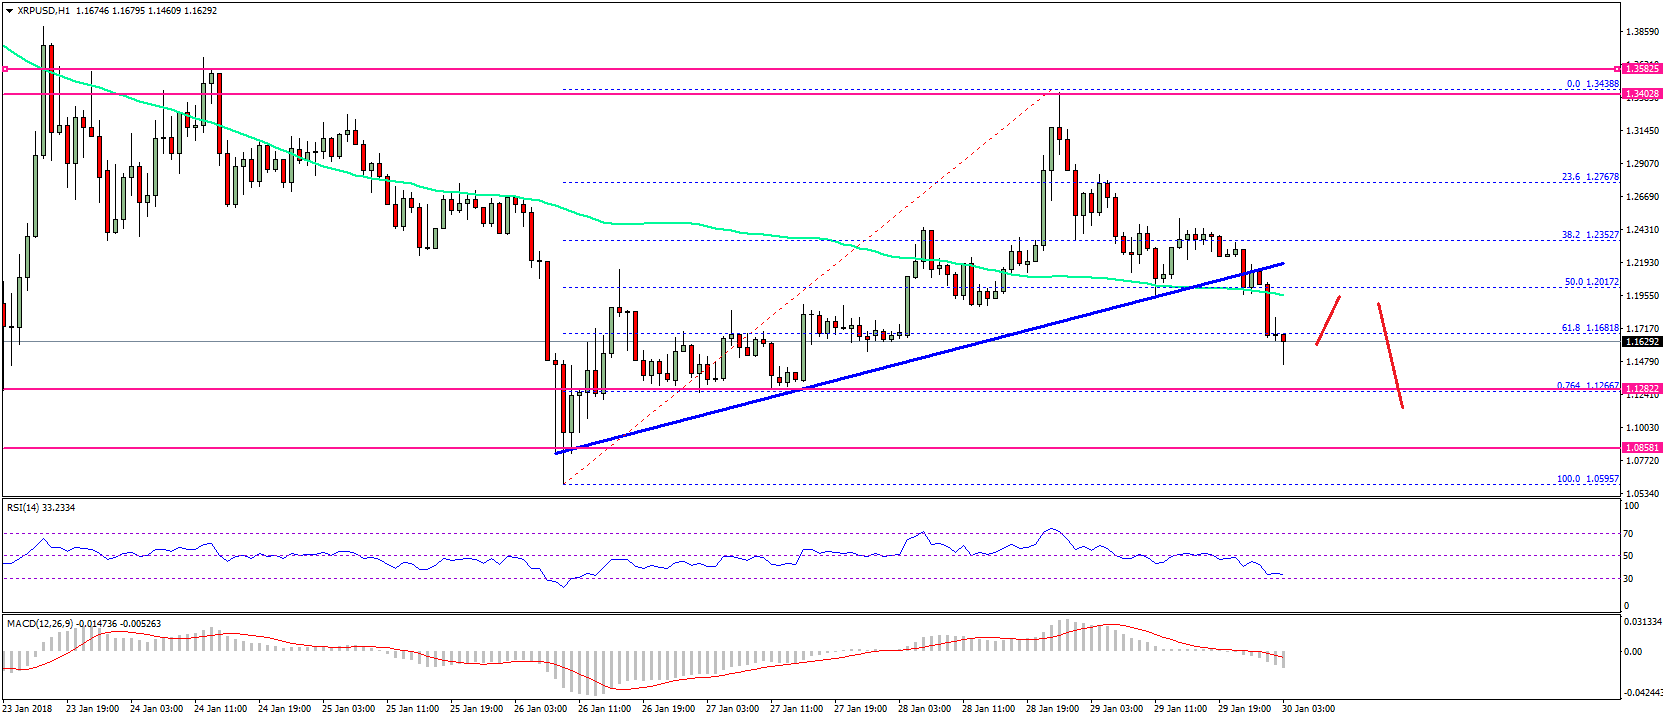
Should there be a break and close below $1.1250, there can be a test of the $1.0000 handle. On the upside, the broken support near $1.2100 and the 100 hourly SMA are likely to prevent recoveries.
Looking at the technical indicators:
Hourly MACD – The MACD for XRP/USD is gaining pace in the bearish zone.
Hourly RSI (Relative Strength Index) – The RSI for XRP/USD is moving lower towards the 30 level.
Major Support Level – $1.1250
Major Resistance Level – $1.2500
Charts courtesy – SimpleFX


