
Reason to trust
How Our News is Made
Strict editorial policy that focuses on accuracy, relevance, and impartiality
Ad discliamer
Morbi pretium leo et nisl aliquam mollis. Quisque arcu lorem, ultricies quis pellentesque nec, ullamcorper eu odio.
Key Highlights
- Ripple price remains in a bearish zone and is currently trading well below $0.6500 against the US dollar.
- There is a significant bearish trend line forming with resistance near $0.6500 on the hourly chart of the XRP/USD pair (data source from Kraken).
- The pair has to stay above the $0.6100 and $0.6000 support levels to stay in a bullish zone.
Ripple price is facing a tough resistance against the US Dollar and Bitcoin. XRP/USD must clear the $0.6500 resistance to start an upside move.
Ripple Price Resistance
There was a continuous increase in selling pressure below $0.7000 on Ripple price against the US Dollar. The price declined and traded below a key support level at $0.6500. There was also a close below the $0.6400 level and the 100 hourly simple moving average. However, the downside move was stopped near the $0.6000 level and $0.6100 pivot.
The recent low was formed at $0.6213 before the price started an upside move. It traded above the 23.6% Fib retracement level of the last downside move from the $0.6750 high to $0.6213 low. However, the upside move was capped by the $0.6500 resistance and the 100 hourly simple moving average. There is also a significant bearish trend line forming with resistance near $0.6500 on the hourly chart of the XRP/USD pair. Lastly, the 50% Fib retracement level of the last downside move from the $0.6750 high to $0.6213 low acted as a hurdle for buyers.
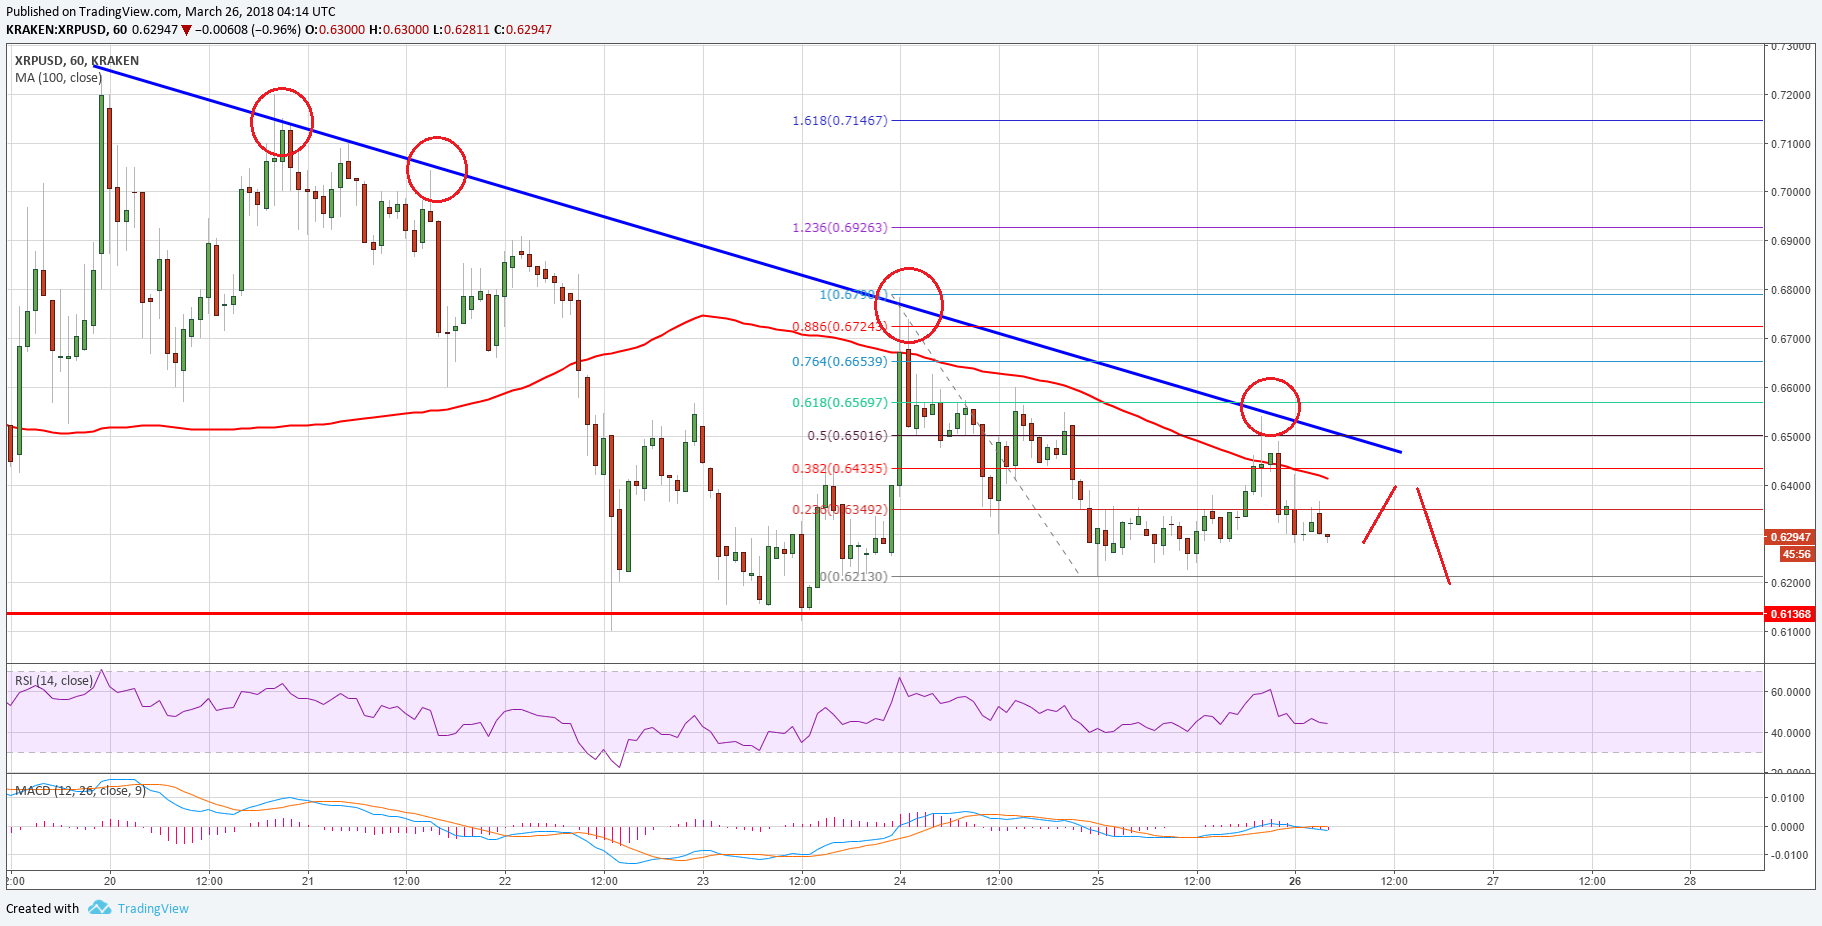
The pair is now in a bearish zone below $0.6500 and the 100 hourly SMA. It has to hold the $0.6000 and $0.6100 support levels to avoid any further declines. On the upside, a break above the $0.6500 resistance is needed for a decent recovery.
Looking at the technical indicators:
Hourly MACD – The MACD for XRP/USD remains in the bearish zone.
Hourly RSI (Relative Strength Index) – The RSI for XRP/USD is now well below the 50 level.
Major Support Level – $0.6000
Major Resistance Level – $0.6500
Charts courtesy – Trading View


