
Reason to trust
How Our News is Made
Strict editorial policy that focuses on accuracy, relevance, and impartiality
Ad discliamer
Morbi pretium leo et nisl aliquam mollis. Quisque arcu lorem, ultricies quis pellentesque nec, ullamcorper eu odio.
Key Highlights
- Ripple price failed to remain in a bullish zone and broke the $0.9450 support against the US dollar.
- Yesterday’s short-term connecting bullish trend line with support at $0.9400 was broken on the hourly chart of the XRP/USD pair (data source from Kraken).
- The pair is currently under pressure and it may fall back towards the $0.8800.
Ripple price declined further in the bearish zone against the US Dollar and Bitcoin. XRP/USD may accelerate declines towards or below $0.8800.
Ripple Price Decline
There was no recovery above $1.00 yesterday in Ripple price against the US Dollar. The price extended declines and moved below a major support area near $0.9400. The decline was substantial as the price closed below the $0.9200 support as well. There was even a close below the 100 hourly simple moving average and the price traded as low as $0.8928.
During the downside move, yesterday’s short-term connecting bullish trend line with support at $0.9400 was broken on the hourly chart of the XRP/USD pair. It opened the doors for more gains and the price is now at a risk of more declined below $0.8900. An initial resistance on the upside is around the 23.6% Fib retracement level of the last decline from the $0.9802 high to $0.8928 low. There are many hurdles on the upside near the $0.9400 level and the 100 hourly SMA. Moreover, the 50% Fib retracement level of the last decline from the $0.9802 high to $0.8928 low is at $0.9356.
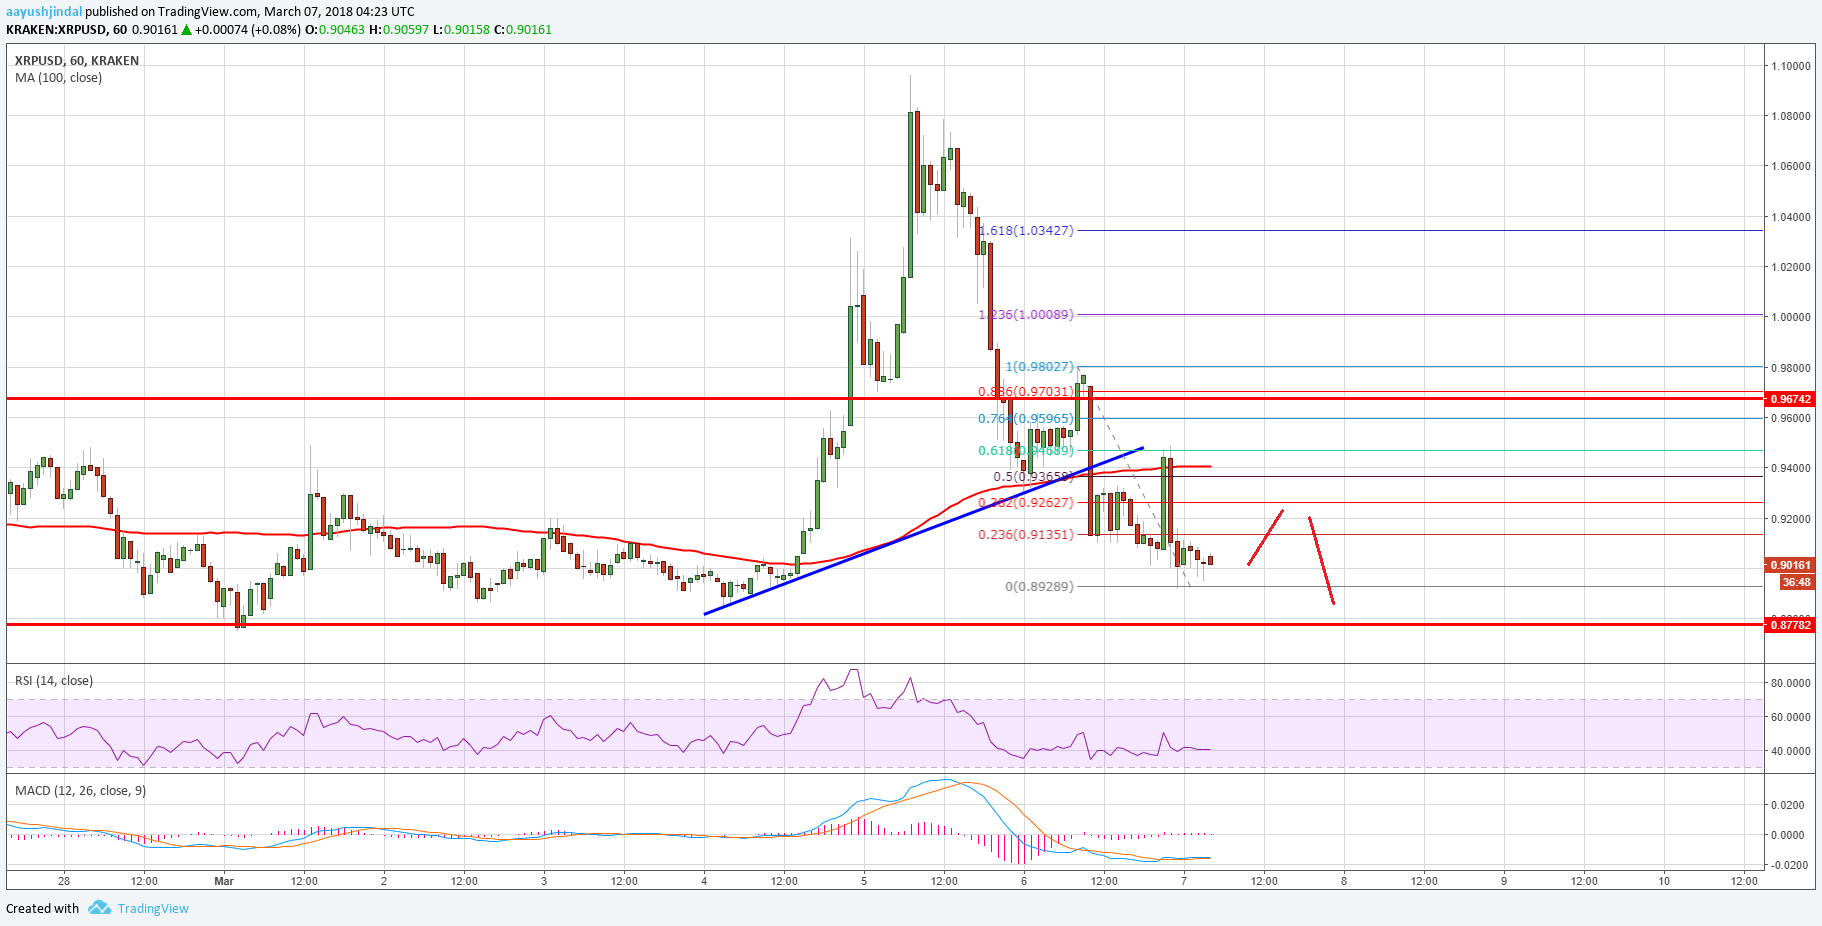
On the downside, the recent low of $0.8928 is a short term support. A break below the mentioned level could push the price towards $0.8800. Any further losses below $0.8800 could be very bearish for XRP in the near term.
Looking at the technical indicators:
Hourly MACD – The MACD for XRP/USD is placed nicely in the bearish zone.
Hourly RSI (Relative Strength Index) – The RSI for XRP/USD is currently well below the 50 level.
Major Support Level – $0.8800
Major Resistance Level – $0.9400
Charts courtesy – Trading View


.85 Now. =D Buying like a kid in a candystore!