
Reason to trust
How Our News is Made
Strict editorial policy that focuses on accuracy, relevance, and impartiality
Ad discliamer
Morbi pretium leo et nisl aliquam mollis. Quisque arcu lorem, ultricies quis pellentesque nec, ullamcorper eu odio.
Key Highlights
- Ripple price failed to hold gains above $0.5180 and declined sharply against the US dollar.
- There was a break below yesterday’s pointed bullish trend line with support at $0.5185 on the hourly chart of the XRP/USD pair (data source from Kraken).
- The pair is now trading well below the $0.5000 level and the 100 hourly simple moving average.
Ripple price is showing a few negative signs against the US Dollar and Bitcoin. XRP/USD may correct a few points higher, but it could face sellers near $0.50 and 100 SMA.
Ripple Price Support
Yesterday, we saw a rise above the $0.5200 level in Ripple price against the US Dollar. However, the price failed to surpass the $0.5500 level and started a downside move. It traded lower and broke a major support at $0.5200. There was also a break below the 50% Fib retracement level of the last upside wave from the $0.4815 low to $0.5530 high.
More importantly, there was a break below yesterday’s pointed bullish trend line with support at $0.5185 on the hourly chart of the XRP/USD pair. The pair even settled below the $0.5000 support and the 100 hourly simple moving average. The recent low was formed at $0.4749 from where the price may recover. It is currently testing the 23.6% Fib retracement level of the last decline from the $0.5530 high to $0.4749 low. However, the most important resistance is near $0.5000 and the 100 hourly SMA. It also coincides with the 38.2% Fib retracement level of the last drop from the $0.5530 high to $0.4749 low.
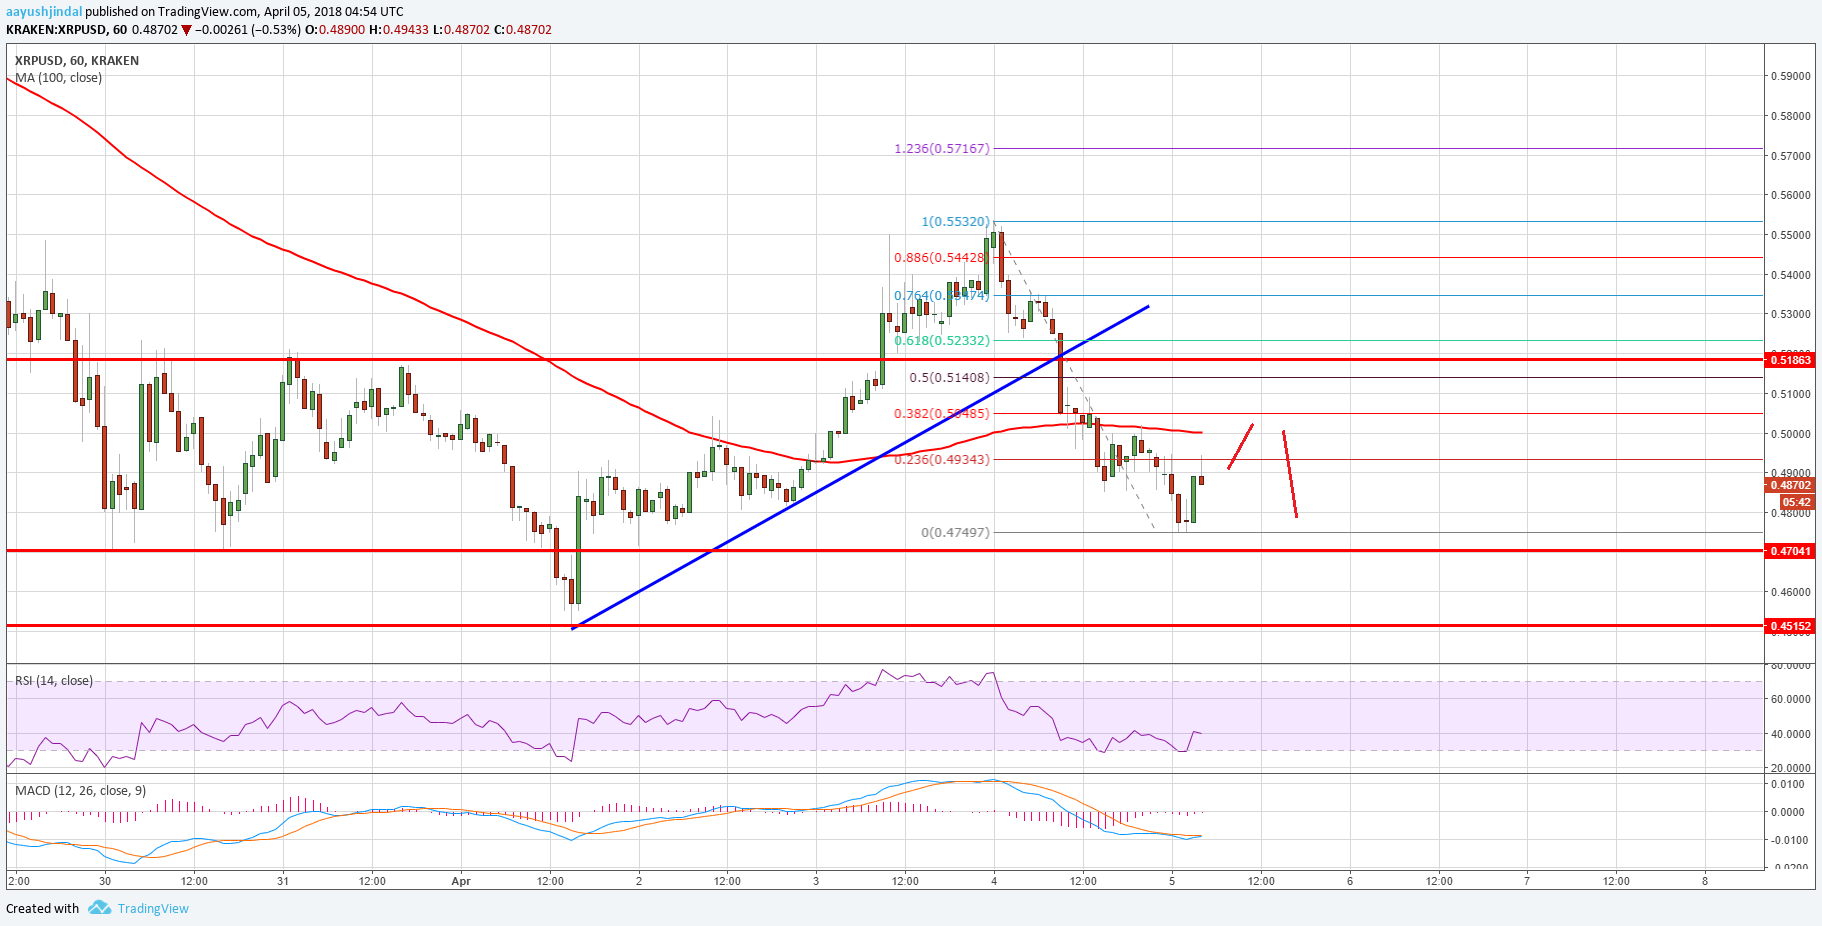
On the downside, the $0.4700 and $0.4500 levels are important supports. A break below the $0.4500 level could spark heavy losses in the near term.
Looking at the technical indicators:
Hourly MACD – The MACD for XRP/USD is now in the bearish zone.
Hourly RSI (Relative Strength Index) – The RSI for XRP/USD is currently near the 35 level.
Major Support Level – $0.4700
Major Resistance Level – $0.5000
Charts courtesy – Trading View


