
Reason to trust
How Our News is Made
Strict editorial policy that focuses on accuracy, relevance, and impartiality
Ad discliamer
Morbi pretium leo et nisl aliquam mollis. Quisque arcu lorem, ultricies quis pellentesque nec, ullamcorper eu odio.
Key Highlights
- Ripple price is holding the $0.8200 support area and is currently approaching a break against the US dollar.
- There is a major contracting triangle forming with resistance at $0.8550 on the hourly chart of the XRP/USD pair (data source from SimpleFx).
- A break and close above $0.8500 and $0.8600 could open the doors for more gains.
Ripple price is slowly stabilizing against the US Dollar and Bitcoin. XRP/USD must break the $0.8600 resistance to gain upside momentum in the near term.
Ripple Price Resistance
There was a downside move below $0.9000 in Ripple price this past week against the US Dollar. The price traded below the $0.8500 support level and tested the $0.8000 low. Later, it started consolidating in a range and an intermediate low was formed at $0.8195. An upside move was initiated and the price moved above the 23.6% Fib retracement level of the last drop from the $0.9322 high to $0.8195 low.
The range pattern is contracting and it seems like the pair is approaching a break with support at $0.8200. There is also a major contracting triangle forming with resistance at $0.8550 on the hourly chart of the XRP/USD pair. The triangle resistance is near the 38.2% Fib retracement level of the last drop from the $0.9322 high to $0.8195 low. Moreover, the 100 hourly simple moving average is positioned near the $0.8620 level. It means there is a major resistance forming near $0.8600-0.8620. Once there is a close above the stated $0.8620 level, there could be more gains in the near term.
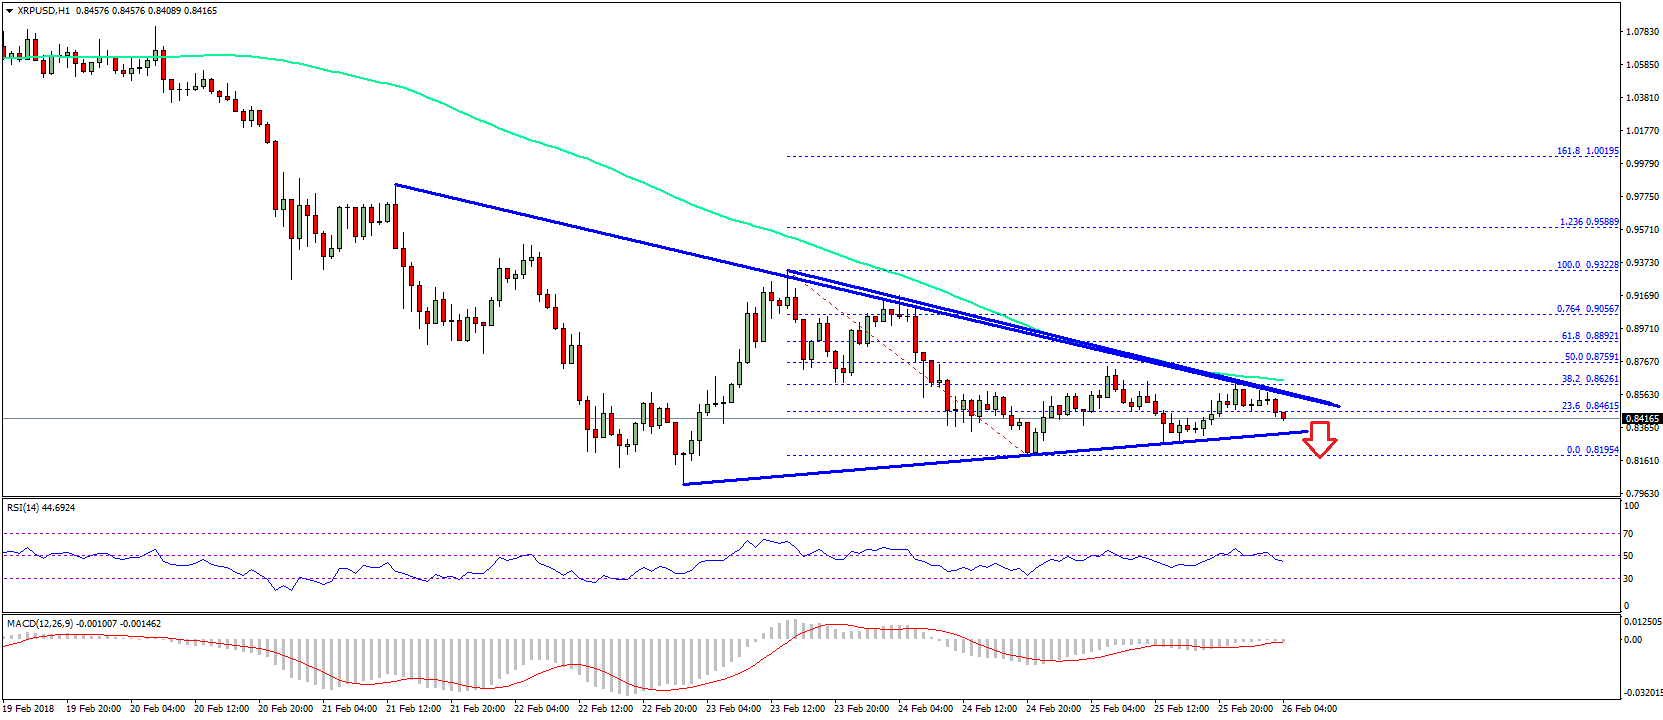
On the downside, the price must stay above the $0.8200 level. If there is a close below the $0.8200 level, there can be a downside push towards $0.8000.
Looking at the technical indicators:
Hourly MACD – The MACD for XRP/USD is about to move into the bullish zone.
Hourly RSI (Relative Strength Index) – The RSI for XRP/USD is struggling to remain above the 50 level.
Major Support Level – $0.8200
Major Resistance Level – $0.8600
Charts courtesy – SimpleFX


Partnering with Google Pay will reverse this.