
Reason to trust
How Our News is Made
Strict editorial policy that focuses on accuracy, relevance, and impartiality
Ad discliamer
Morbi pretium leo et nisl aliquam mollis. Quisque arcu lorem, ultricies quis pellentesque nec, ullamcorper eu odio.
Key Highlights
- Ripple price declined recently and moved below the $0.2060 support area against the US Dollar.
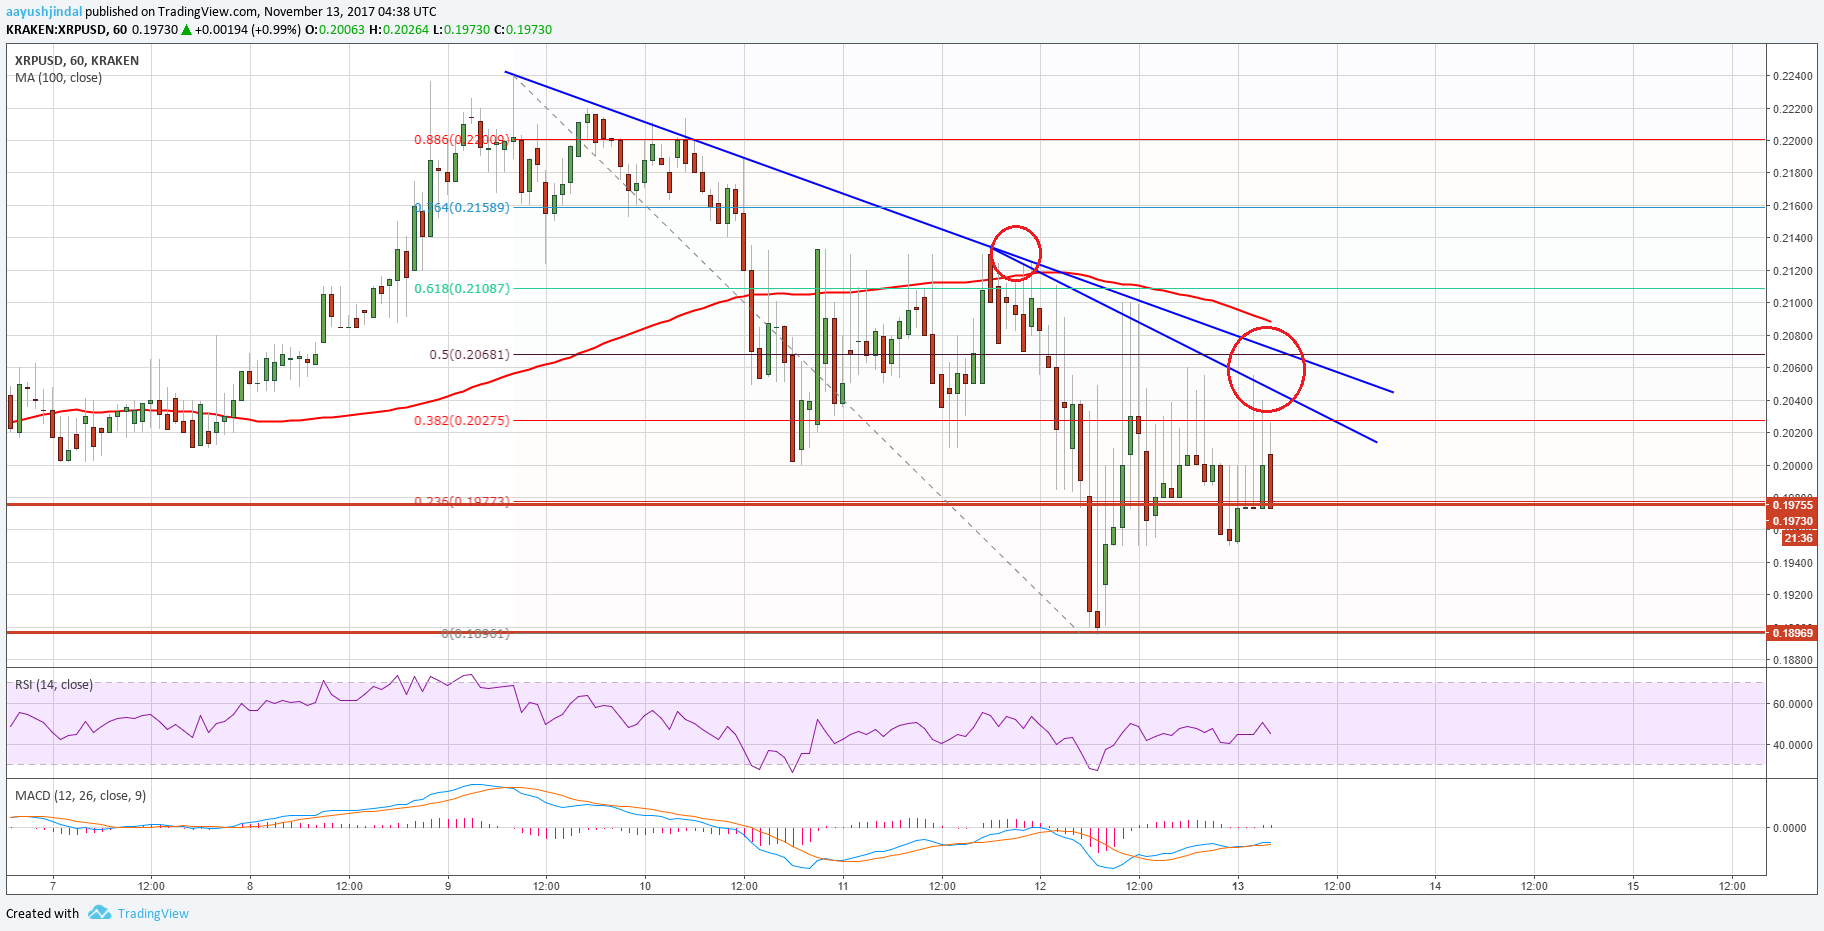
- There are two bearish trend lines forming with resistance at $0.2030 on the hourly chart of the XRP/USD pair (data source from Kraken).
- The price is currently correcting higher, but it is facing many resistances near $0.2060.
Ripple price declined recently against the US Dollar and Bitcoin. XRP/USD is now below $0.2060 and struggling to recover in the short term.
Ripple Price Resistance
There was a decent upside move in Ripple price above $0.2200 this past week against the US Dollar. The price traded as high as $0.2240 before it started a downside move. It declined sharply and moved below the $0.2100 and $0.2060 support levels to settle below the 100 hourly simple moving average. It even broke the $0.1960 support area and traded as low as $0.1896.
A recovery was initiated later, which took the price above the $0.1970 level. XRP also moved above the 23.6% Fib retracement level of the last decline from the $0.2240 high to $0.1896 low. On the upside, there are two bearish trend lines forming with resistance at $0.2030 on the hourly chart of the XRP/USD pair. The $0.2030 resistance is also near the 50% Fib retracement level of the last decline from the $0.2240 high to $0.1896 low. Therefore, a close above the $0.2030 and $0.2060 resistance levels won’t be easy in the near term.
On the downside, the $0.1900 level is a decent support. Below $0.1900, the recent low near $1896 might provide support. The overall trend is neutral with chances of a dip back toward the $0.1900 level in the near term.
Looking at the technical indicators:
Hourly MACD – The MACD for XRP/USD is attempting to move back in the bullish zone.
Hourly RSI (Relative Strength Index) – The RSI for XRP/USD is above the 50 level and heading higher.
Major Support Level – $0.2180
Major Resistance Level – $0.2250
Charts courtesy – Trading View, Kraken


