
Reason to trust
How Our News is Made
Strict editorial policy that focuses on accuracy, relevance, and impartiality
Ad discliamer
Morbi pretium leo et nisl aliquam mollis. Quisque arcu lorem, ultricies quis pellentesque nec, ullamcorper eu odio.
Key Highlights
- Ripple price started an upside correction and moved above the $0.6500 level against the US dollar.
- There is a crucial bearish trend line forming with resistance at $0.7200 on the hourly chart of the XRP/USD pair (data source from Kraken).
- The pair must move above the $0.7200 resistance and the 100 hourly simple moving average to gain momentum.
Ripple price is slowly recovering against the US Dollar and Bitcoin. XRP/USD has to move above the $0.7200-0.7300 zone to recover further in the near term.
Ripple Price Upside Hurdle
There was a major decline noted yesterday towards $0.6200 in Ripple price against the US Dollar. The price traded as low as $0.6260 and later started an upside correction. It moved above the $0.6500 resistance to start an upside recovery. It also traded above the 38.2% Fib retracement level of the last drop from the $0.7899 high to $0.6267 swing low.
However, the upside move was protected by a major resistance near $0.7080-0.7100. The stated $0.7080 level was a support earlier and now it is acting as a resistance. Moreover, the 50% Fib retracement level of the last drop from the $0.7899 high to $0.6267 swing low also protected losses. At the moment, the price is consolidating around the $0.7000 level and is preparing for the next move. To the topside, there is a crucial bearish trend line forming with resistance at $0.7200 on the hourly chart of the XRP/USD pair.
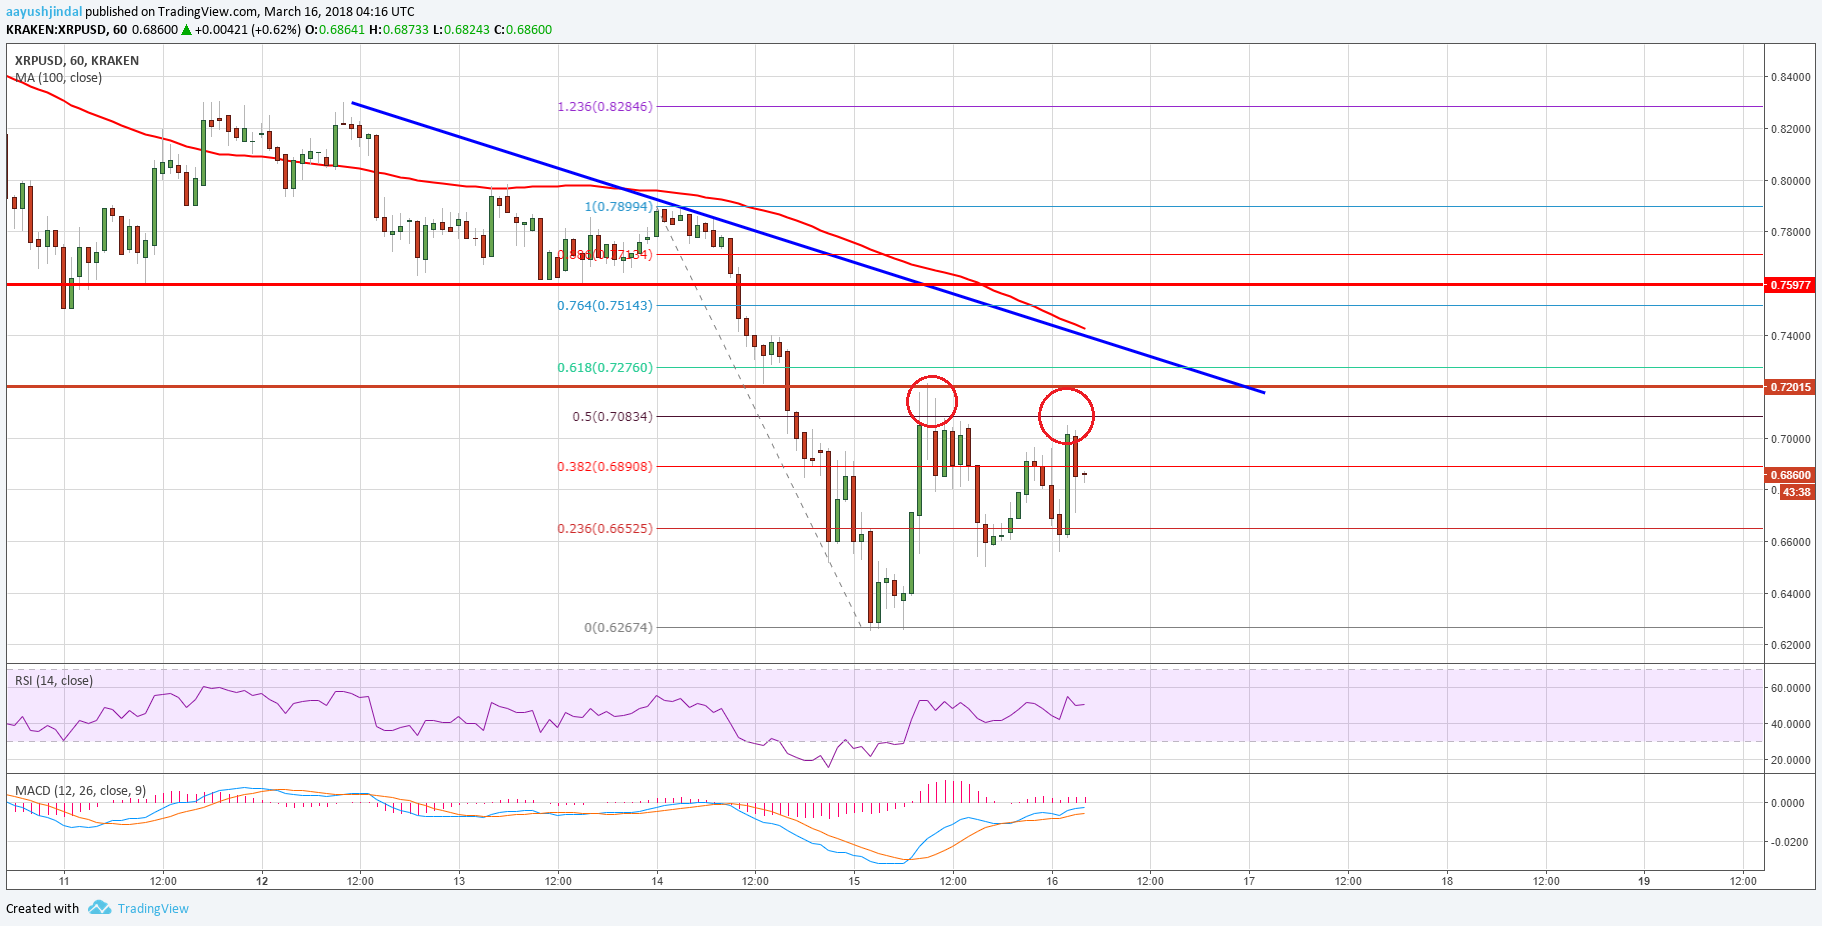
The 100 hourly simple moving average is also positioned around the $0.7100 level. Therefore, a break above the $0.7080 and $0.7100 levels is must for further recoveries. On the downside, the $0.6500 level is a decent support followed by the $0.6200 swing low.
Looking at the technical indicators:
Hourly MACD – The MACD for XRP/USD is slowly moving in the bullish zone.
Hourly RSI (Relative Strength Index) – The RSI for XRP/USD is currently just above the 50 level.
Major Support Level – $0.6500
Major Resistance Level – $0.7080
Charts courtesy – Trading View


