
Reason to trust
How Our News is Made
Strict editorial policy that focuses on accuracy, relevance, and impartiality
Ad discliamer
Morbi pretium leo et nisl aliquam mollis. Quisque arcu lorem, ultricies quis pellentesque nec, ullamcorper eu odio.
Key Highlights
- Ripple price is currently moving inside a range below the $0.7300 resistance against the US dollar.
- There is a short-term contracting triangle forming with support near $0.6900 on the hourly chart of the XRP/USD pair (data source from SimpleFx).
- The pair looks set to make the next move either above $0.7400 or below $0.6900 in the near term.
Ripple price is poised to make the next move against the US Dollar and Bitcoin. XRP/USD may soon climb higher above the $0.7300 and $0.7400 resistance levels.
Ripple Price Resistance
There was no major upside move above $0.7400 during the past two sessions in Ripple price against the US Dollar. The price attempted an upside break above $0.7400-0.7500 recently, but it failed to gain momentum. The recent high was $0.7640 from where the price mostly traded inside a range. It moved below the 23.6% Fib retracement level of the last wave from the $0.5180 low to $0.7640 high.
However, the downside move was protected by the $0.6600 support area. Moreover, the 38.2% Fib retracement level of the last wave from the $0.5180 low to $0.7640 high also acted as a support. At the moment, it seems like the price is preparing for the next move either above $0.7400 or below $0.6900 in the near term. There is a short-term contracting triangle forming with support near $0.6900 on the hourly chart of the XRP/USD pair. A break above the $0.7400 level could push the price above $0.7600 or even $0.8000.
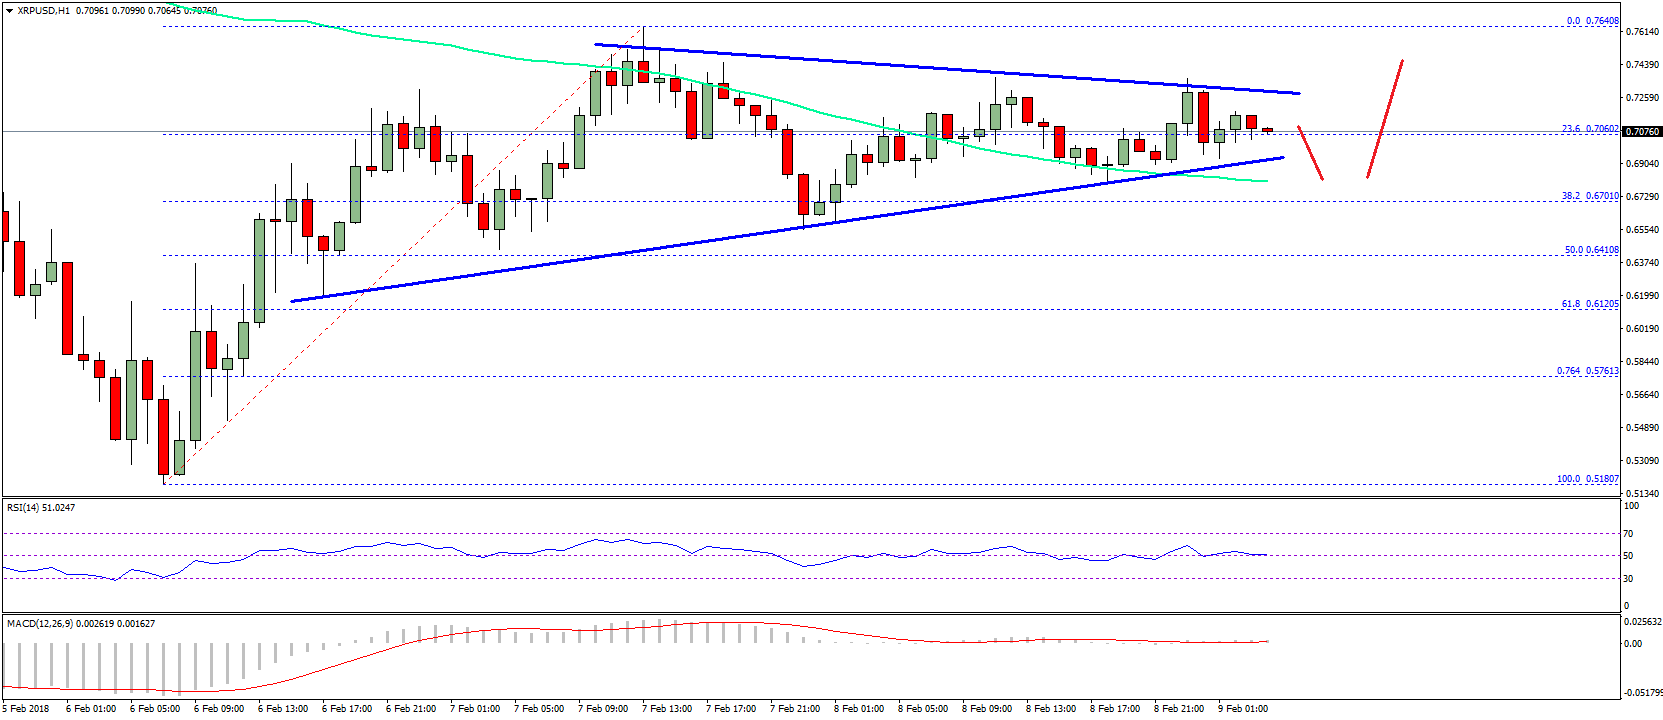
On the downside, the $0.7000 and $0.6900 levels are decent supports. The pair has to stay above the $0.6900 level to make an upside move, otherwise, it could retest the $0.6500 support.
Looking at the technical indicators:
Hourly MACD – The MACD for XRP/USD is mostly flat with a few bearish signs.
Hourly RSI (Relative Strength Index) – The RSI for XRP/USD is just above the 50 level.
Major Support Level – $0.6900
Major Resistance Level – $0.7400
Charts courtesy – SimpleFX


Your analysis that it was either going to down or up was 100% correct.
That was brilliant wasn’t it. Lol
I’m just happy which way it went!