
Reason to trust
How Our News is Made
Strict editorial policy that focuses on accuracy, relevance, and impartiality
Ad discliamer
Morbi pretium leo et nisl aliquam mollis. Quisque arcu lorem, ultricies quis pellentesque nec, ullamcorper eu odio.
Key Highlights
- Ripple price failed to rise further and started a downside move from the $0.7246 high against the US dollar.
- There is a major bearish trend line forming with resistance near $0.6850 on the hourly chart of the XRP/USD pair (data source from Kraken).
- The pair is currently trading just above the $0.6100 support and it remains at a risk of more losses.
Ripple price is under short-term pressure against the US Dollar and Bitcoin. XRP/USD must stay above the $0.6100 support to avoid further declines in the near term.
Ripple Price Decline
After trading above the $0.7000 level, Ripple price failed to hold gains against the US Dollar. The price started a downside move and traded below the $0.7000 level and the 100 hourly simple moving average. It also broke the 23.6% Fib retracement level of the last upside wave from the $0.5324 low to $0.7246 high. More importantly, there was a break below the $0.6500, which has opened the doors for more declines.
The downside move was such that the price even broke the $0.6400 support. More importantly, there was a break below the 50% Fib retracement level of the last upside wave from the $0.5324 low to $0.7246 high. At the moment, the price is testing a major support at $0.6100. It must hold the stated $0.6100 support, else there is a risk of more declines in the near term. On the upside, the broken $0.6400 support may act as a resistance.
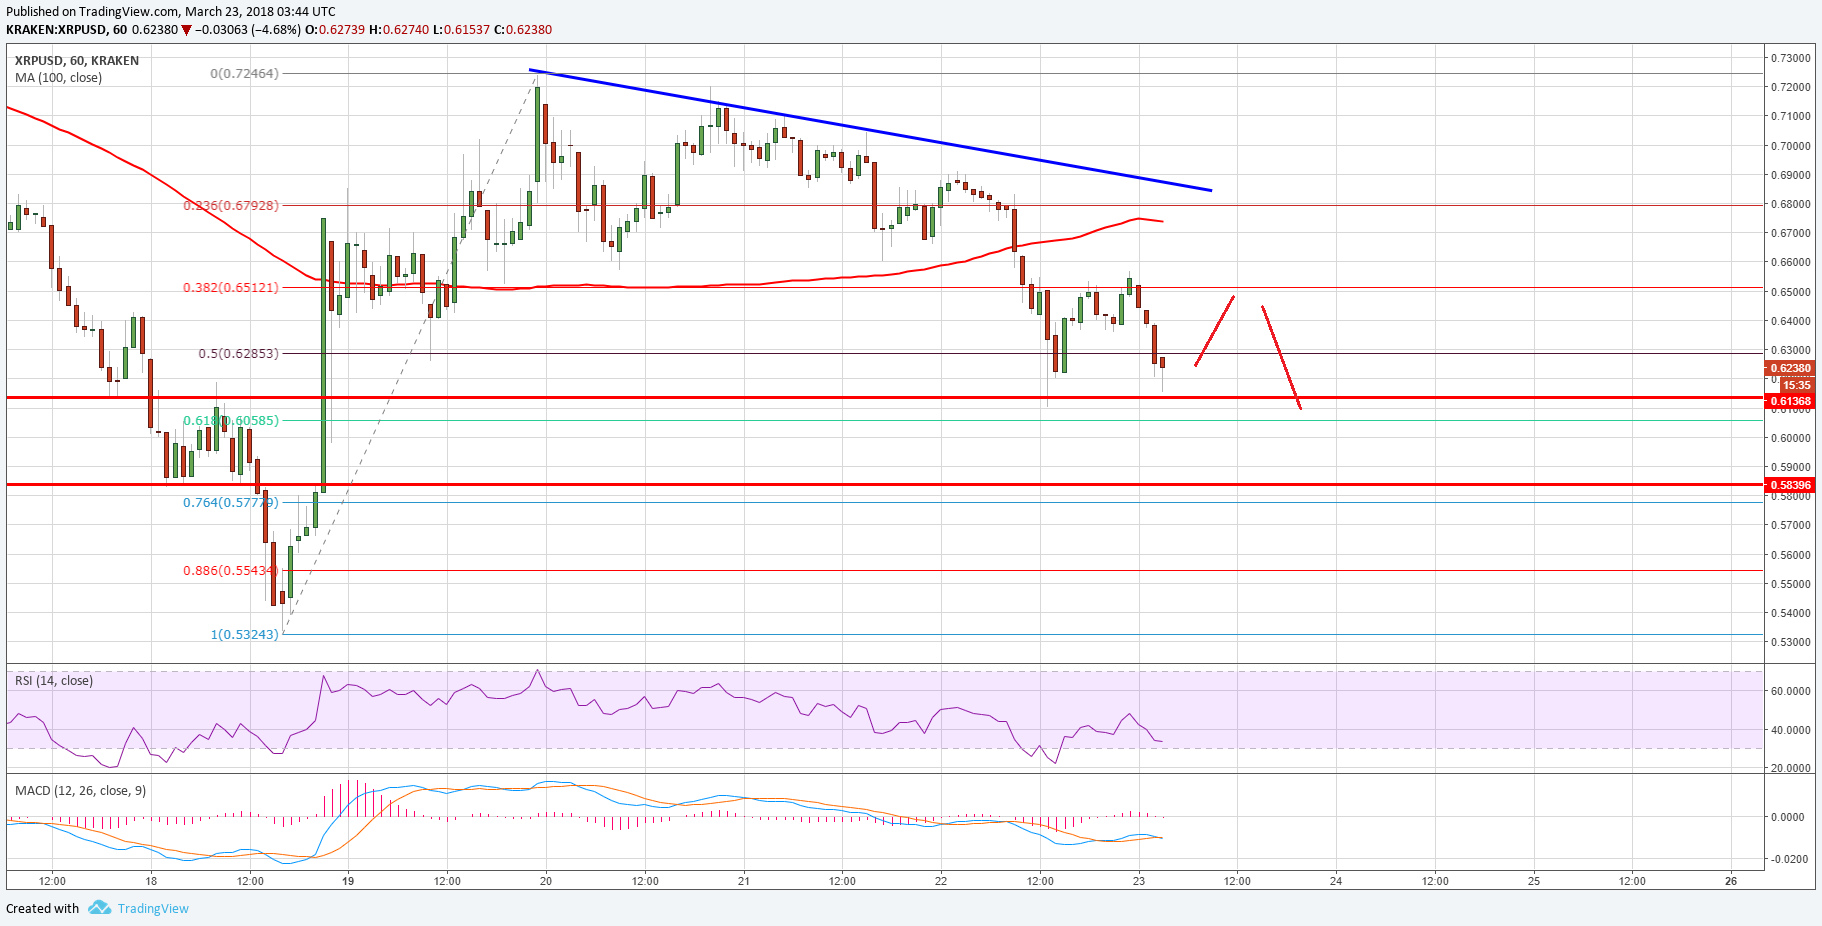
Above $0.6400, the next hurdle is at $0.6500, followed by a major bearish trend line forming with resistance near $0.6850 on the hourly chart of the XRP/USD pair. Moreover, the 100 hourly SMA is at $0.6700 to act as a resistance for an upside move.
Looking at the technical indicators:
Hourly MACD – The MACD for XRP/USD is moving slowly in the bearish zone.
Hourly RSI (Relative Strength Index) – The RSI for XRP/USD is currently well below the 50 level.
Major Support Level – $0.6100
Major Resistance Level – $0.6500
Charts courtesy – Trading View


