
Reason to trust
How Our News is Made
Strict editorial policy that focuses on accuracy, relevance, and impartiality
Ad discliamer
Morbi pretium leo et nisl aliquam mollis. Quisque arcu lorem, ultricies quis pellentesque nec, ullamcorper eu odio.
Key Highlights
- Ripple price declined further and failed to stay above the $0.2300 level against the US Dollar.
- Yesterday’s highlighted major bearish trend line with current resistance at $0.2400 is intact on the hourly chart of the XRP/USD pair (data source from Kraken).
- The pair might continue to struggle and it will be difficult for buyers to keep the price above $0.2200.
Ripple price extended declines against the US Dollar and Bitcoin. XRP/USD is currently testing $0.2200 and struggling to hold the stated level.
Ripple Price Decline
There were further losses in Ripple price from the $0.2400 swing high against the US Dollar. The price slowly and steadily moved down below the $0.2350 and $0.2300 support levels. It traded close to the $0.2200 level and formed a low at $0.2190. Later, there was an upside correction and the price moved above the 23.6% Fib retracement level of the last decline from the $0.2600 high to $0.2190 low.
However, the upside move was capped by the $0.2350 resistance. Moreover, the 38.2% Fib retracement level of the last decline from the $0.2600 high to $0.2190 low also acted as a resistance. XRP declined once again and is currently trading near the $0.2200 support area. On the upside, yesterday’s highlighted major bearish trend line with current resistance at $0.2400 is intact on the hourly chart of the XRP/USD pair. The trend line resistance at $0.2400 is also around the 100 hourly simple moving average.
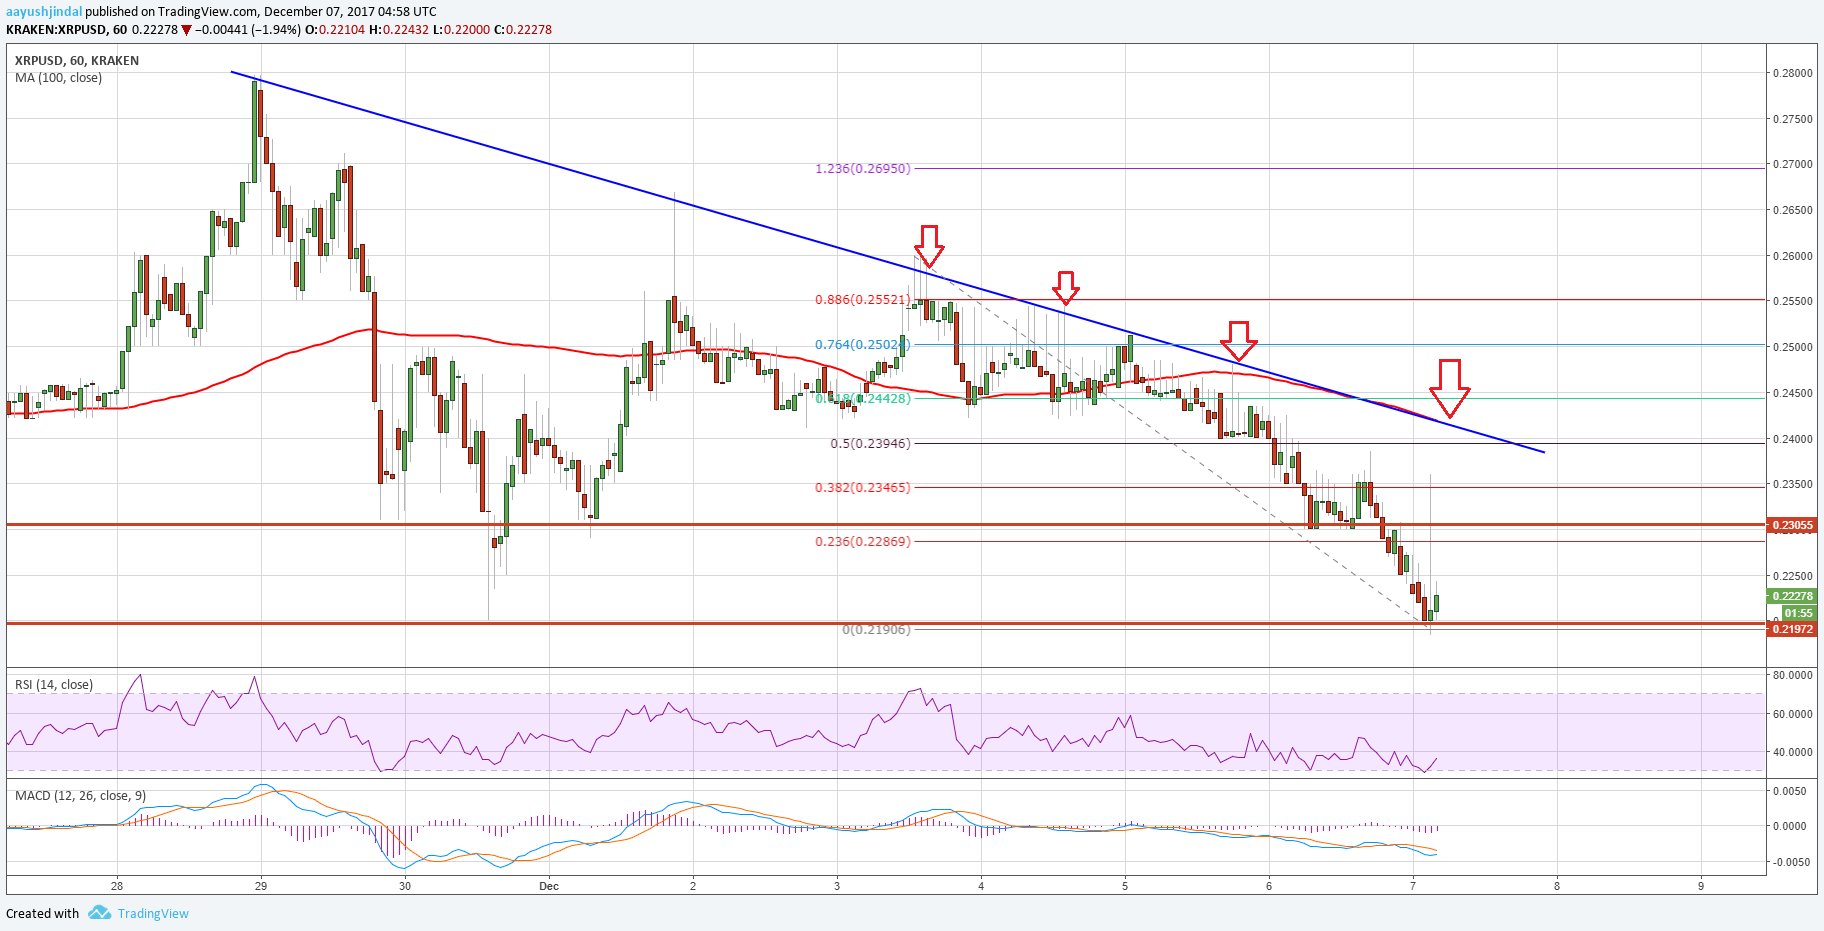
Therefore, the $0.2350 and $0.2400 levels are important resistances on the upside. As long as the price is below the $2400, there can be more declines in XRP/USD in the short term.
Looking at the technical indicators:
Hourly MACD – The MACD for XRP/USD is gaining pace in the bearish zone and is showing a lot of negative signs.
Hourly RSI (Relative Strength Index) – The RSI for XRP/USD is now below the 40 level and is in the bearish zone.
Major Support Level – $0.2200
Major Resistance Level – $0.2400
Charts courtesy – Trading View, Kraken


