
Reason to trust
How Our News is Made
Strict editorial policy that focuses on accuracy, relevance, and impartiality
Ad discliamer
Morbi pretium leo et nisl aliquam mollis. Quisque arcu lorem, ultricies quis pellentesque nec, ullamcorper eu odio.
Key Highlights
- Ripple price failed to move higher and declined below the $0.9000 support against the US dollar.
- There is a connecting bearish trend line forming with resistance at $0.9100 on the hourly chart of the XRP/USD pair (data source from Kraken).
- The pair is currently at a risk of more declines below the $0.8800 and $0.8600 support levels.
Ripple price is struggling to gain upside momentum against the US Dollar and Bitcoin. XRP/USD is testing the $0.8800 support and it decline further in the near term.
Ripple Price Resistance
There was a minor upside move from the $0.8900 swing low in Ripple price against the US Dollar. The price traded higher, but it was not able to break the $0.9100 resistance. It also failed to near the 100 hourly simple moving average and declined below $0.9000. There was an hourly close below the $0.9000 support and the 100 SMA, which is a bearish sign.
The recent low was formed at $0.8749 and the price seems to be holding the $0.8800 support. An initial resistance on the upside is around the 23.6% Fib retracement level of the last decline from the $0.9596 high to $0.8749 low. There is also a connecting bearish trend line forming with resistance at $0.9100 on the hourly chart of the XRP/USD pair. Moreover, the trend line resistance is close to the 38.2% Fib retracement level of the last decline from the $0.9596 high to $0.8749 low. Therefore, if the price corrects higher, it may face sellers near the $0.9100 resistance level.
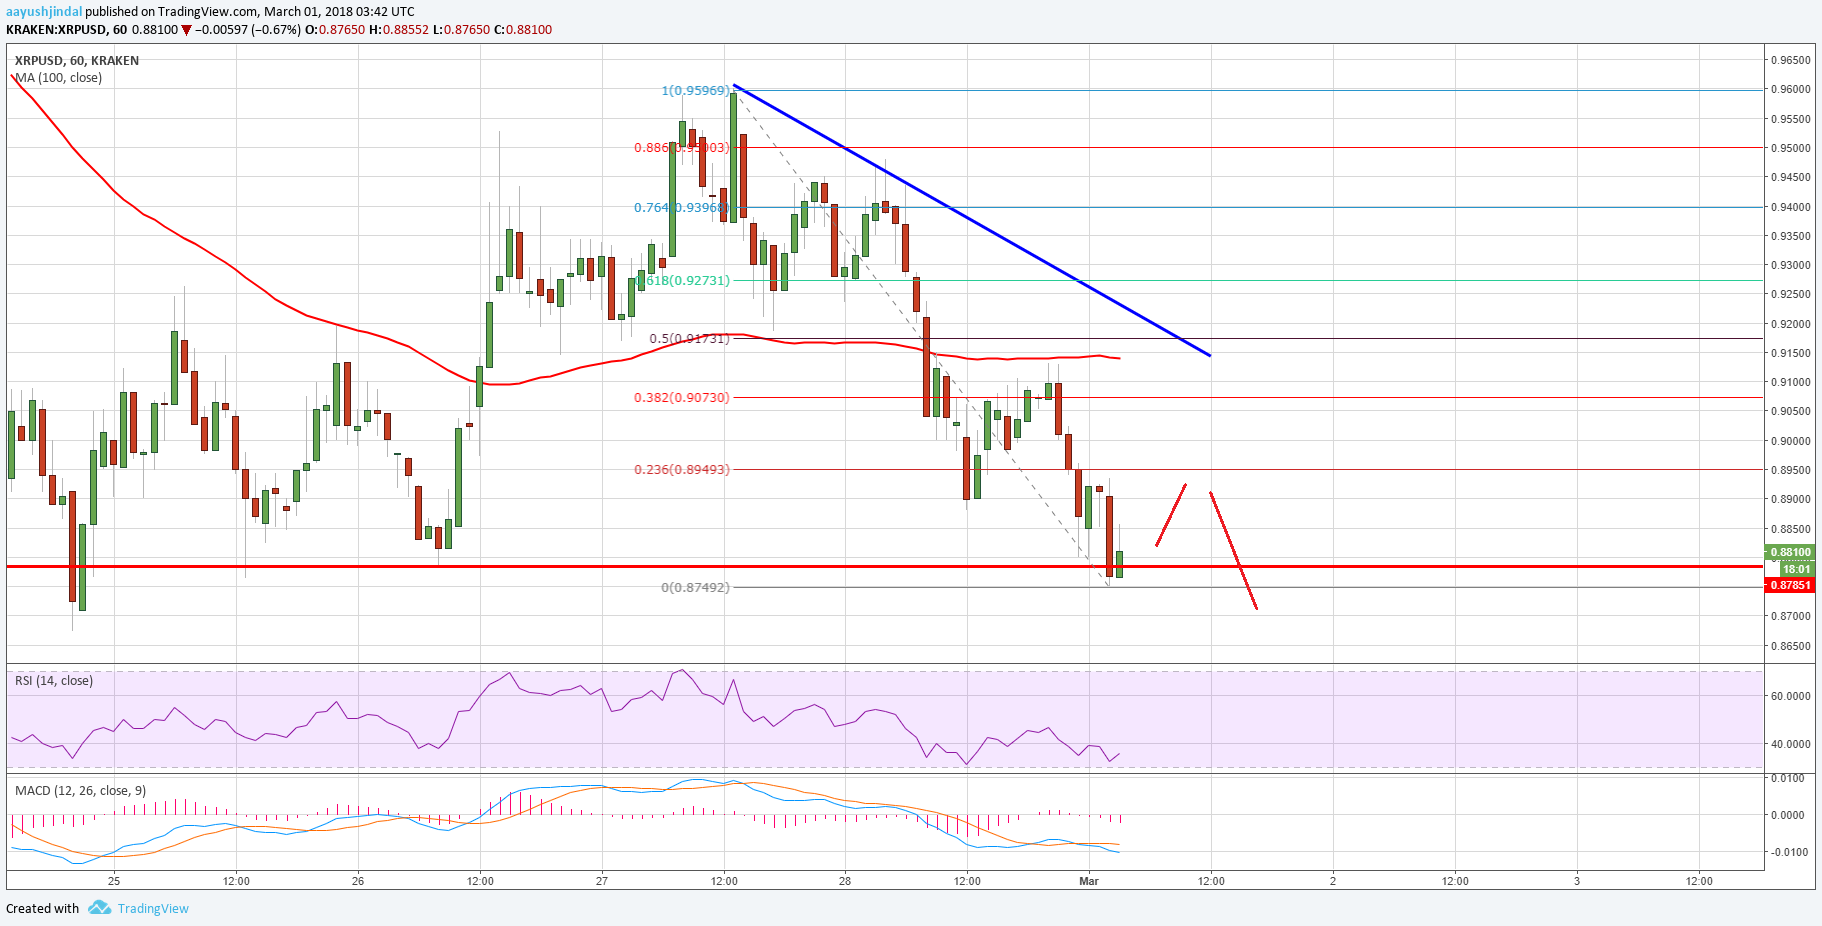
On the downside, a break below the $0.8800 support could ignite more declines. The next major support is at $0.8400 followed by the $0.8200 level.
Looking at the technical indicators:
Hourly MACD – The MACD for XRP/USD is mostly in the bearish zone with negative signs.
Hourly RSI (Relative Strength Index) – The RSI for XRP/USD is currently well below the 50 level.
Major Support Level – $0.8800
Major Resistance Level – $0.9100
Charts courtesy – Trading View


