
Reason to trust
How Our News is Made
Strict editorial policy that focuses on accuracy, relevance, and impartiality
Ad discliamer
Morbi pretium leo et nisl aliquam mollis. Quisque arcu lorem, ultricies quis pellentesque nec, ullamcorper eu odio.
Key Highlights
- Ripple price is struggling to move higher and is currently trading below $1.0850 against the US dollar.
- There is a major contracting triangle pattern forming with resistance at $1.0700 on the hourly chart of the XRP/USD pair (data source from SimpleFx).
- The pair has to move above $1.0700 and the 100 hourly simple moving average to move further higher.
Ripple price is slowly moving away from the bullish zone against the US Dollar and Bitcoin. XRP/USD must break above $1.0700 and the 100 hourly SMA to avoid further declines.
Ripple Price Upside Hurdle
There was no upside break above $1.12 in Ripple price during the past three sessions against the US Dollar. The price started a slow and steady downside move and traded below $1.10. It also traded below the $1.0750 support and the 100 hourly simple moving average. The last upside move not sustainable above the 50% Fib retracement level of the last drop from the 1.1510 swing high to $1.0050 swing low.
There was no hourly close above the $1.10 level, which ignited a downside wave. At the moment, there is a major contracting triangle pattern forming with resistance at $1.0700 on the hourly chart of the XRP/USD pair. The pair is approaching a short-term break either above $1.0700 or below $1.0400. On the upside, above $1.0700, the price could test the 61.8% Fib retracement level of the last drop from the 1.1510 swing high to $1.0050 swing low at $1.0945. Above the mentioned $1.0945, the price may perhaps move above the $1.10 level.
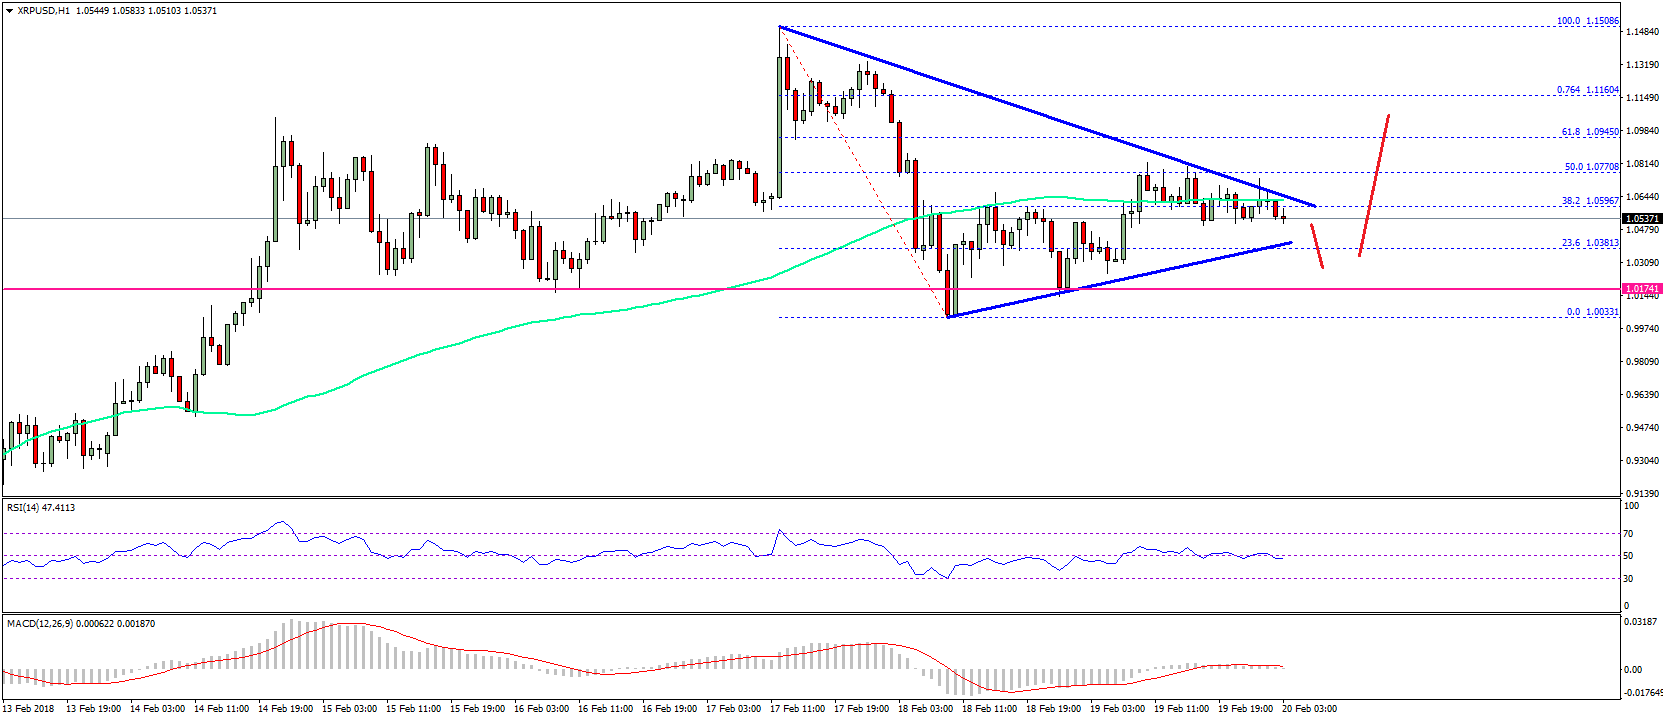
On the flip side, if the pair fails to move above the 100 hourly SMA, it could decline back towards $1.0200 in the near term.
Looking at the technical indicators:
Hourly MACD – The MACD for XRP/USD is now moving in the bearish zone.
Hourly RSI (Relative Strength Index) – The RSI for XRP/USD has moved below the 50 level.
Major Support Level – $1.0400
Major Resistance Level – $1.0700
Charts courtesy – SimpleFX


No disrespect, but it appears that you are wrong most of the time. Always downplaying Ripple growth. Always the mouthpiece for anti Ripple sentiment
.