
Reason to trust
How Our News is Made
Strict editorial policy that focuses on accuracy, relevance, and impartiality
Ad discliamer
Morbi pretium leo et nisl aliquam mollis. Quisque arcu lorem, ultricies quis pellentesque nec, ullamcorper eu odio.
Key Highlights
- Ripple price made a major bottom near the $0.8399 low and recovered against the US dollar.
- There was a break above yesterday’ highlighted crucial bearish trend line with resistance at $1.45 on the hourly chart of the XRP/USD pair (data source from Kraken).
- The pair is currently facing a huge task near the $1.60 level and the 100 hourly simple moving average.
Ripple price is recovering nicely against the US Dollar and Bitcoin. XRP/USD is now above $1.40, but facing a major resistance near $1.60 and the 100 hourly SMA.
Ripple Price Resistance
Yesterday, we saw a major decline below $1.00 in Ripple price against the US Dollar. The price traded as low as $0.8399 from where it started an upside move. It moved above the 50% Fib retracement level of the last drop from the $1.9027 high to $0.8399 low. The current price action is positive since the price has moved above the $1.00 and $1.20 resistance levels.
More importantly, there was a break above yesterday’ highlighted crucial bearish trend line with resistance at $1.45 on the hourly chart of the XRP/USD pair. However, the pair is currently facing a major hurdle near the $1.50-1.60 levels. The 100 hourly simple moving average is positioned at $1.60 to act as a major barrier for buyers. Moreover, the 61.8% Fib retracement level of the last drop from the $1.9027 high to $0.8399 low is at $1.49. Therefore, it seems like there is a crucial resistance forming near $1.50-1.60.
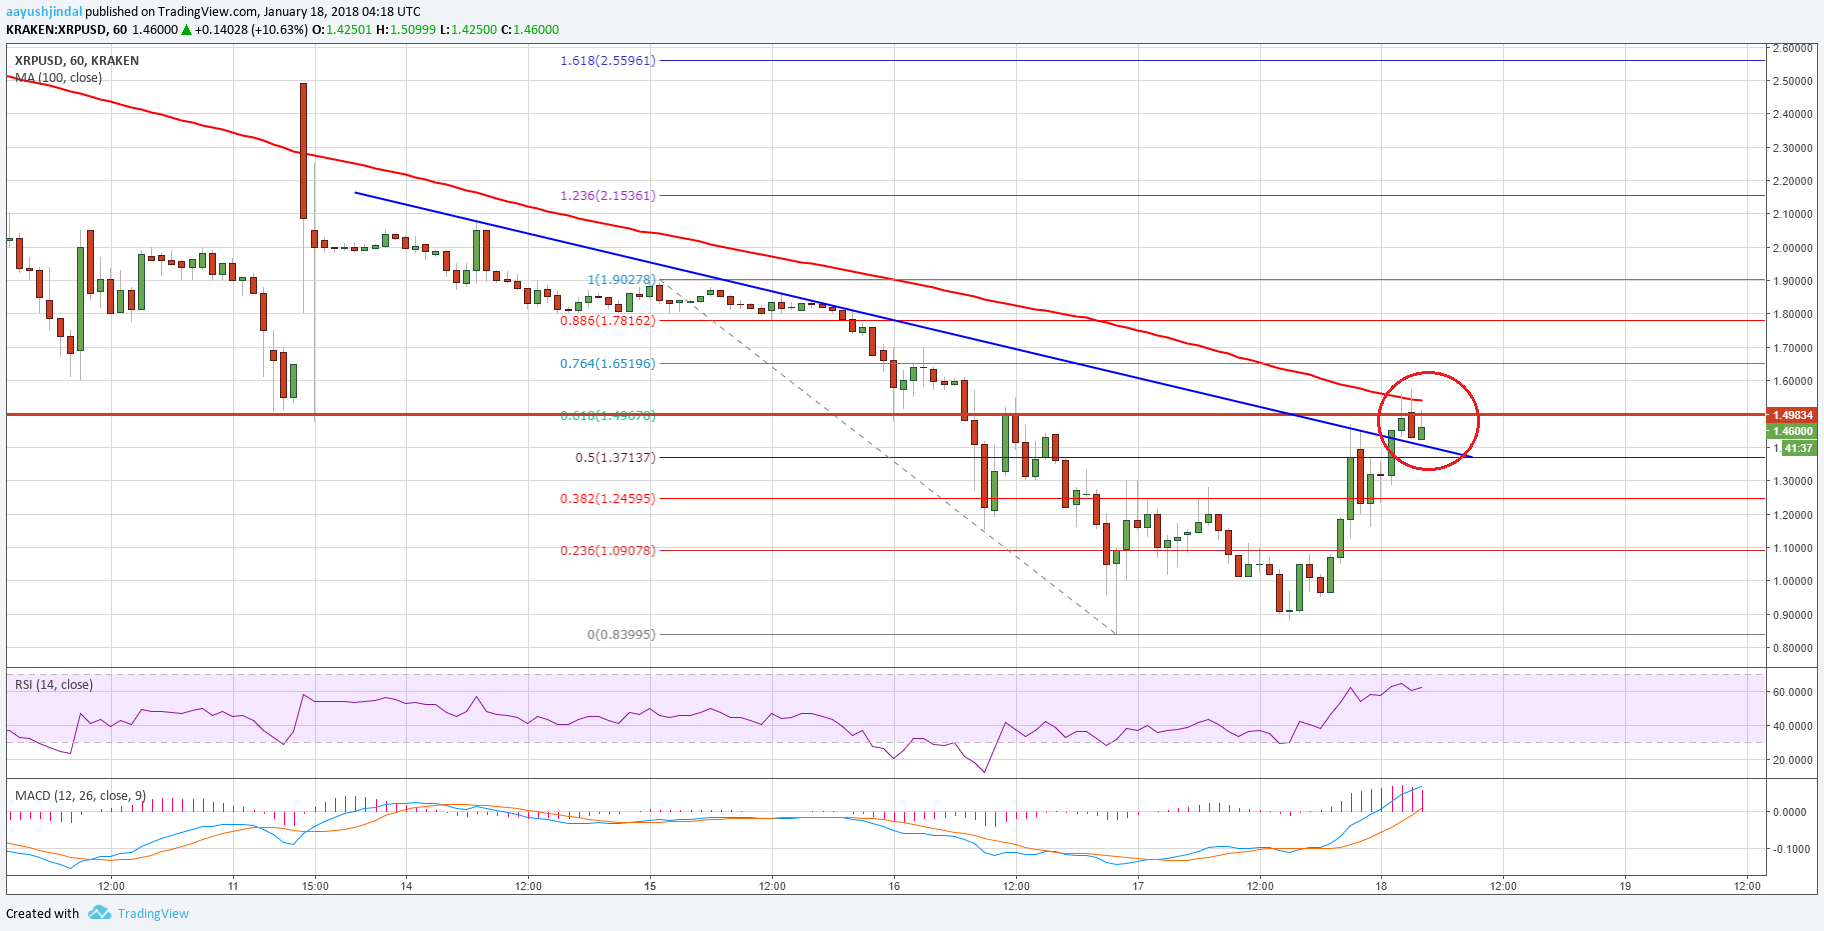
A break above stated $1.60 level is needed for buyers to gain control. On the downside, an initial support is at $1.30. However, the most important support is now at $1.20, which is a buy zone.
Looking at the technical indicators:
Hourly MACD – The MACD for XRP/USD is now back in the bullish zone.
Hourly RSI (Relative Strength Index) – The RSI for XRP/USD is currently well above the 50 level.
Major Support Level – $1.20
Major Resistance Level – $1.60
Charts courtesy – Trading View, Kraken


Nice analysis, but let’s hope BTC could also broke its resistance level.