
Reason to trust
How Our News is Made
Strict editorial policy that focuses on accuracy, relevance, and impartiality
Ad discliamer
Morbi pretium leo et nisl aliquam mollis. Quisque arcu lorem, ultricies quis pellentesque nec, ullamcorper eu odio.
Key Highlights
- Ripple price failed to hold gains above the $0.5000 level and declined against the US dollar.
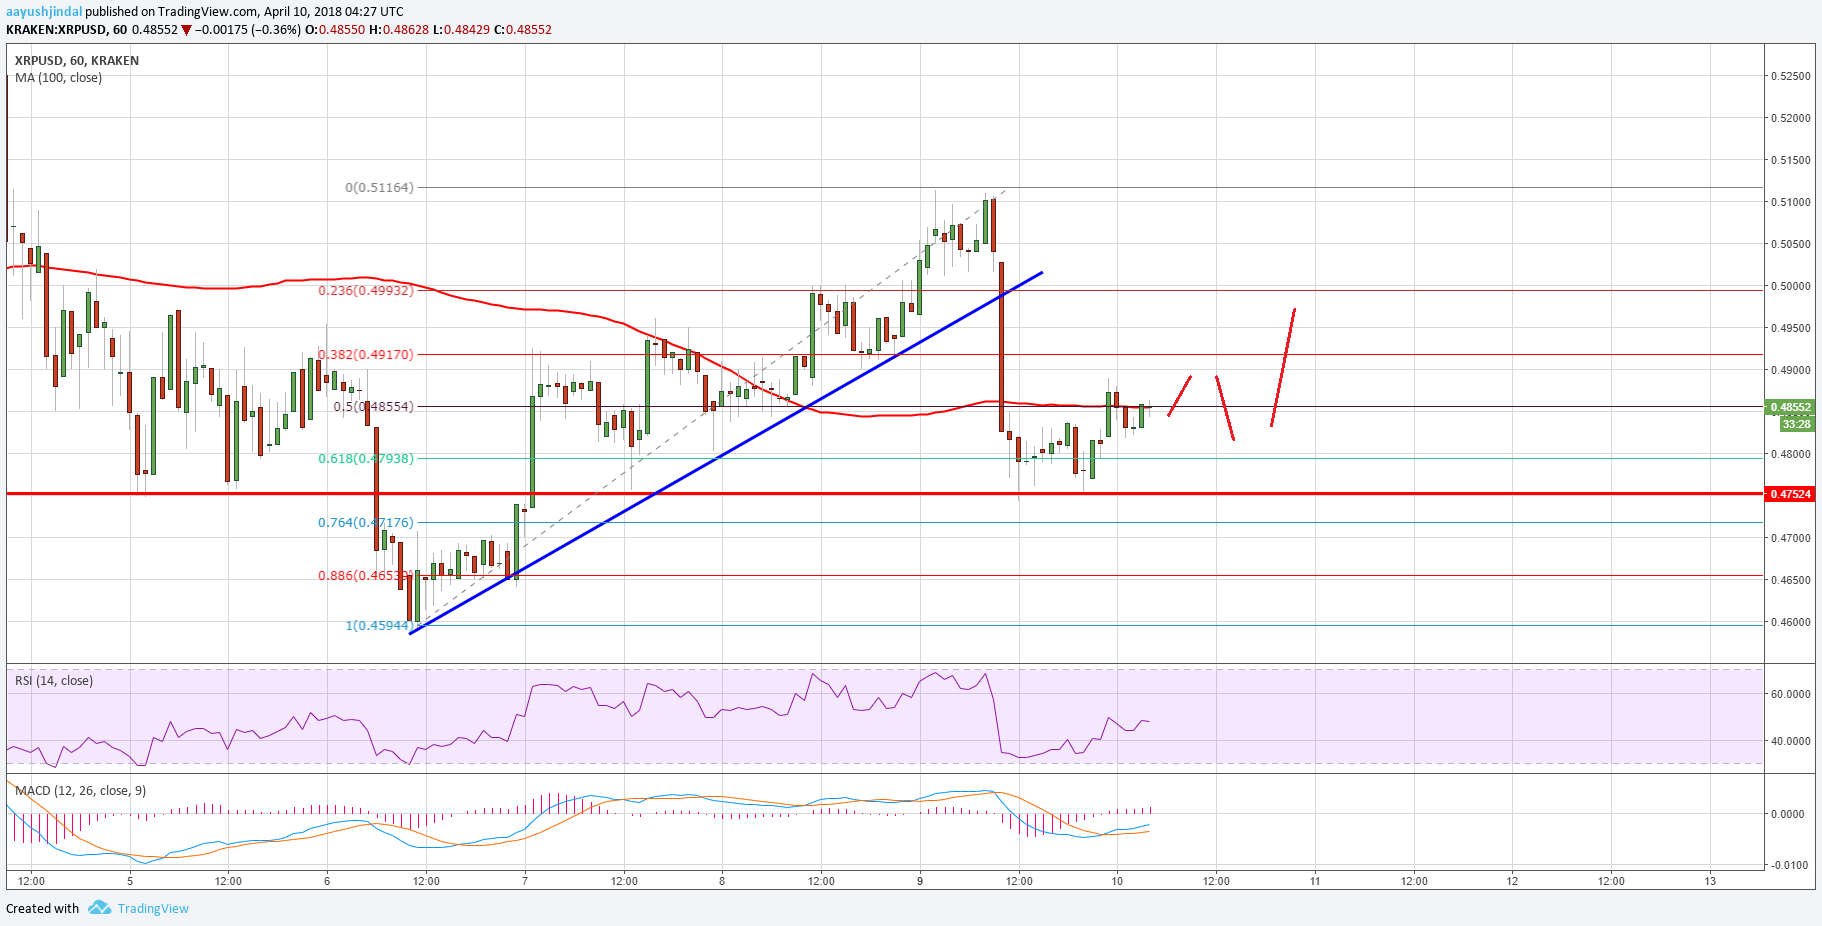
- Yesterday’s highlighted important bullish trend line with support at $0.5020 was broken on the hourly chart of the XRP/USD pair (data source from Kraken).
- The pair is currently holding the $0.4750 support, which is a positive sign in the short term.
Ripple price is once again struggling against the US Dollar and Bitcoin. XRP/USD must stay above the $0.4750 support to bounce back above $0.5000.
Ripple Price Decline
Yesterday, we saw a decent upside move above the $0.4800 level in Ripple price against the US Dollar. The price even traded above the $0.5000 resistance level. However, it failed to hold gains above the $0.5000 level and formed a high near $0.5116. Later, a downside move was initiated and the price declined below the 23.6% Fib retracement level of the last upside wave from the $0.4594 low to $0.5116 high.
More importantly, yesterday’s highlighted important bullish trend line with support at $0.5020 was broken on the hourly chart of the XRP/USD pair. The pair settled below the $0.5000 support and tested $0.4750. There was also a spike below the 61.8% Fib retracement level of the last upside wave from the $0.4594 low to $0.5116 high. However, it seems like the price is holding the $0.4750 support very well. It has to bounce back above the $0.4900 level and the 100 hourly simple moving average to gain upside momentum. Finally, a close above $0.5000 could push the price back in a bullish zone.
On the other hand, if the price fails to stay above $0.4750, it may move in a bearish zone. The next support on the downside sits at $0.4500.
Looking at the technical indicators:
Hourly MACD – The MACD for XRP/USD is slowly moving in the bullish zone.
Hourly RSI (Relative Strength Index) – The RSI for XRP/USD is just below the 50 level.
Major Support Level – $0.4750
Major Resistance Level – $0.5000
Charts courtesy – Trading View


