
Reason to trust
How Our News is Made
Strict editorial policy that focuses on accuracy, relevance, and impartiality
Ad discliamer
Morbi pretium leo et nisl aliquam mollis. Quisque arcu lorem, ultricies quis pellentesque nec, ullamcorper eu odio.
Key Highlights
- Ripple price is struggling to move above the $1.0250 level against the US dollar.
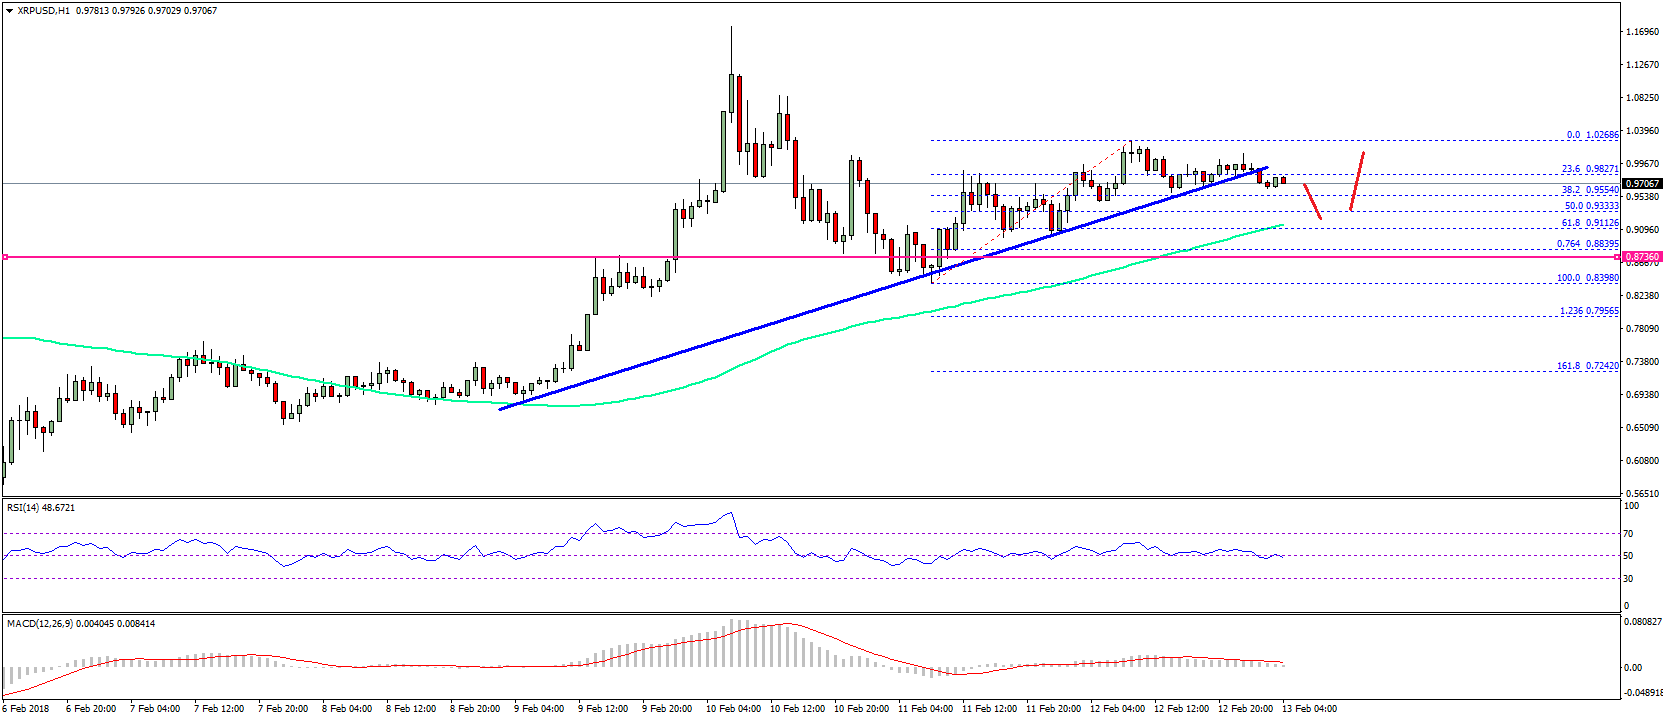
- There was a break below a key bullish trend line with support at $0.9830 on the hourly chart of the XRP/USD pair (data source from SimpleFx).
- The pair could decline further towards the $0.9200 and $0.9000 support levels in the near term.
Ripple price is slowly following a declining path against the US Dollar and Bitcoin. XRP/USD may correct a few points lower with support near $0.9200 and $0.9000.
Ripple Price Trend
Recently, we saw a steady uptrend in Ripple price above the $0.8500 level against the US Dollar. The price moved above the $0.9000 and $0.9500 resistance levels. It also traded above the $1.0000 level and $1.0200. However, it could not gain momentum above the $1.0250 level and later started a downside move. It moved below the 23.6% Fib retracement level of the last wave from the $0.8398 low to $1.0268 high.
More importantly, there was a break below a key bullish trend line with support at $0.9830 on the hourly chart of the XRP/USD pair. It seems like the pair may decline further as long as it is below $1.0000. The next major support on the downside is around the 50% Fib retracement level of the last wave from the $0.8398 low to $1.0268 high at $0.9333. Moreover, the 100 hourly simple moving average is positioned near $0.9200. Therefore, the $0.9200 level is likely to act as a decent support.
Below $0.9200, the $0.9000 level could provide support. On the upside, the price has to settle above $1.0000 and break the $1.0250 resistance to gain upside momentum in the near term.
Looking at the technical indicators:
Hourly MACD – The MACD for XRP/USD is mostly flat with a few bearish signs.
Hourly RSI (Relative Strength Index) – The RSI for XRP/USD has just moved below the 50 level.
Major Support Level – $0.9200
Major Resistance Level – $1.0250
Charts courtesy – SimpleFX


Annoying daytraders. If it weren’t for daytrading, XRP would probably be at $8 right about now 🙁