
Reason to trust
How Our News is Made
Strict editorial policy that focuses on accuracy, relevance, and impartiality
Ad discliamer
Morbi pretium leo et nisl aliquam mollis. Quisque arcu lorem, ultricies quis pellentesque nec, ullamcorper eu odio.
Key Highlights
- Ripple price rallied recently and broke the $0.3000 and $0.3200 resistances against the US dollar.
- Yesterday’s highlighted key bearish trend line was breached with resistance at $0.2850 on the hourly chart of the XRP/USD pair (data source from Kraken).
- The pair traded above the $0.3300 resistance and it may continue to move higher in the near term.
Ripple price jumped back in a bullish zone against the US Dollar and Bitcoin. XRP/USD could continue to move higher towards the $0.3500 resistance zone.
Ripple Price Analysis
There was a solid support formed above the $0.2800 level in ripple price against the US Dollar. The XRP/USD pair traded higher and broke the $0.2950 and $0.3000 resistance levels. There was even a close above the $0.3060 level and the 100 hourly simple moving average. The recent upward move was strong as the price broke the $0.3200 resistance and climbed close to $0.3380.
During the rise, yesterday’s highlighted key bearish trend line was breached with resistance at $0.2850 on the hourly chart of the XRP/USD pair. The pair traded as high as $0.3377 and later corrected lower. It moved below the 23.6% Fib retracement level of the last wave from the $0.2813 low to $0.3377 high. However, the $0.3100 level acted as a strong support and protected more losses. Besides, there was no test of the 50% Fib retracement level of the last wave from the $0.2813 low to $0.3377 high. The price is currently trading nicely above the $0.3200 support area and it seems like it could surge further.
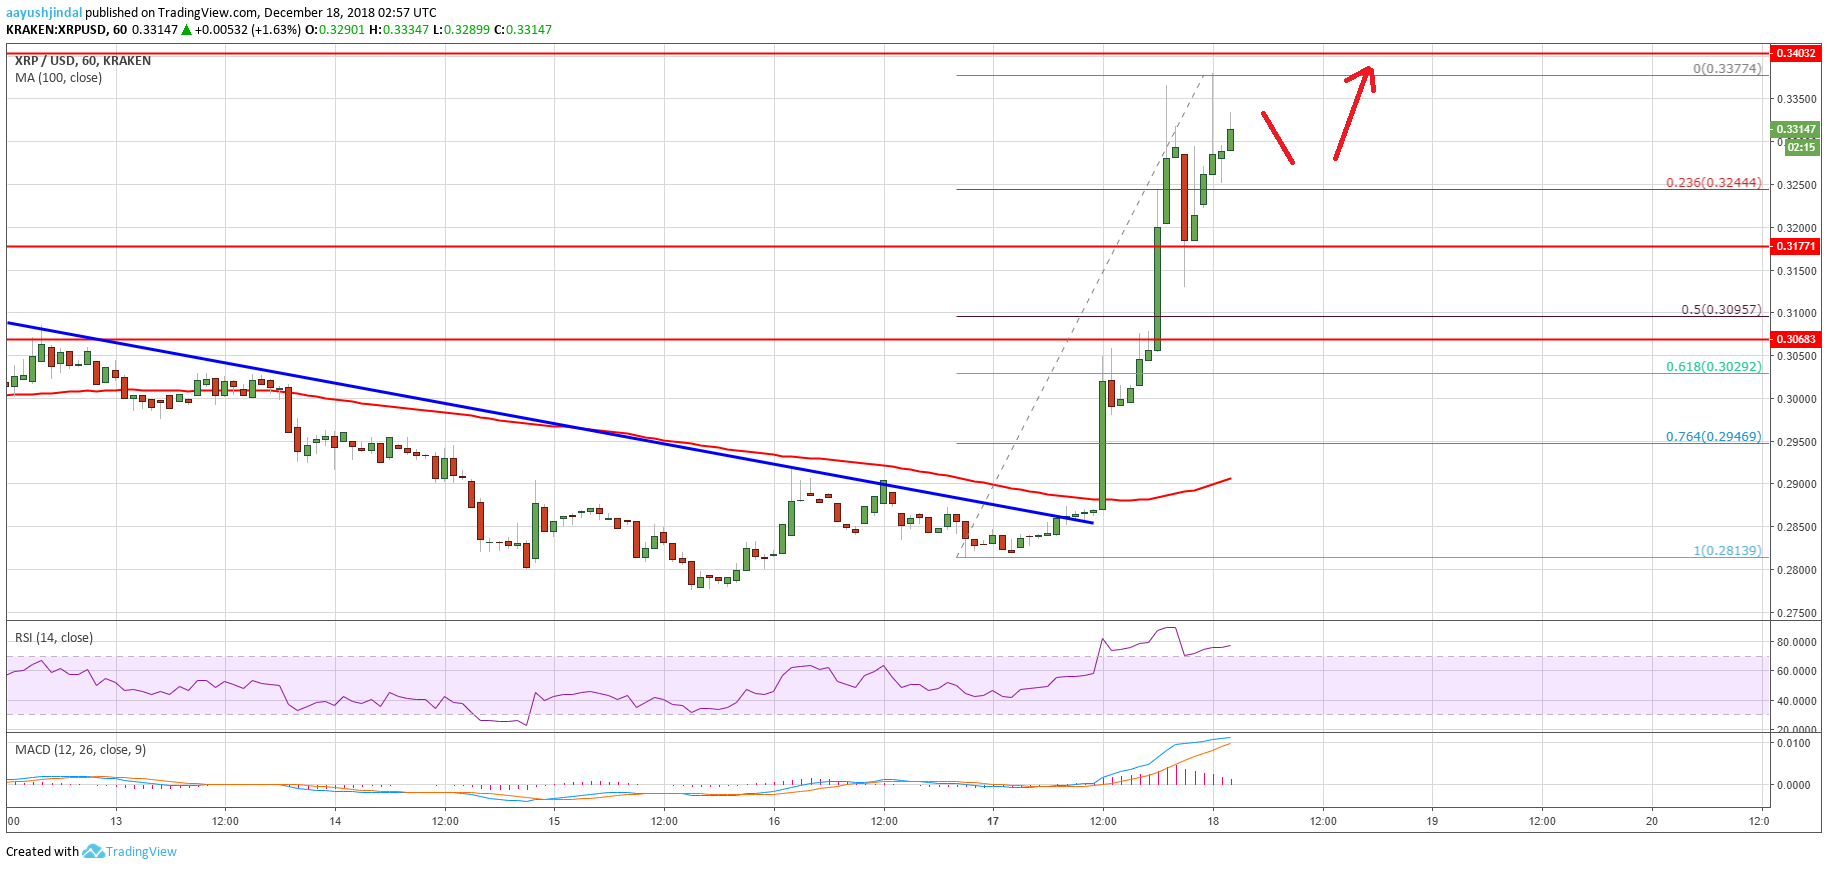
Looking at the chart, ripple price might clear the $0.3377 high and climb towards the $0.3500 or $0.3600 resistance. On the downside, there are many supports, starting with $0.3200 and up to $0.3000.
Looking at the technical indicators:
Hourly MACD – The MACD for XRP/USD is slowly reducing its bullish slope.
Hourly RSI (Relative Strength Index) – The RSI for XRP/USD is currently placed well above the 65 level.
Major Support Level – $0.3200
Major Resistance Level – $0.3380


