
Reason to trust
How Our News is Made
Strict editorial policy that focuses on accuracy, relevance, and impartiality
Ad discliamer
Morbi pretium leo et nisl aliquam mollis. Quisque arcu lorem, ultricies quis pellentesque nec, ullamcorper eu odio.
- Ripple price failed to stay above the $0.3000 support and declined heavily below $0.2900 against the US dollar.
- Yesterday’s highlighted important bearish trend line is in place with resistance at $0.2980 on the hourly chart of the XRP/USD pair (data source from Kraken).
- The pair recovered nicely after trading as low as $0.2777, but it is facing sellers near $0.2950.
Ripple price declined sharply and gained bearish momentum against the US Dollar and Bitcoin. XRP/USD is currently facing a solid resistance near previous supports at $0.2950.
Ripple Price Analysis
Yesterday, we saw the start of a major decline below the $0.3100 support in ripple price against the US Dollar. The XRP/USD pair even failed to stay above the $0.3000 support and extended its decline. It broke the $0.2950 and $0.2920 support levels. The drop was sharp and sellers pushed the price below $0.2800. A low was formed at $0.2777 and the price placed itself well below the 100 hourly simple moving average. Later, there was a sharp bounce and recovery above the $0.2850 level.
The price traded above the 50% Fib retracement level of the recent drop from the $0.3071 high to $0.2777 low. However, the upside move was capped by the previous support near $0.2950. Moreover, the 61.8% Fib retracement level of the recent drop from the $0.3071 high to $0.2777 low acted as a resistance. More importantly, yesterday’s highlighted important bearish trend line is in place with resistance at $0.2980 on the hourly chart of the XRP/USD pair. Therefore, as long as the price is below the $0.2950 and $0.3000 levels, it remains in a downtrend. On the downside, an initial support is at $0.2880, followed by $0.2840.
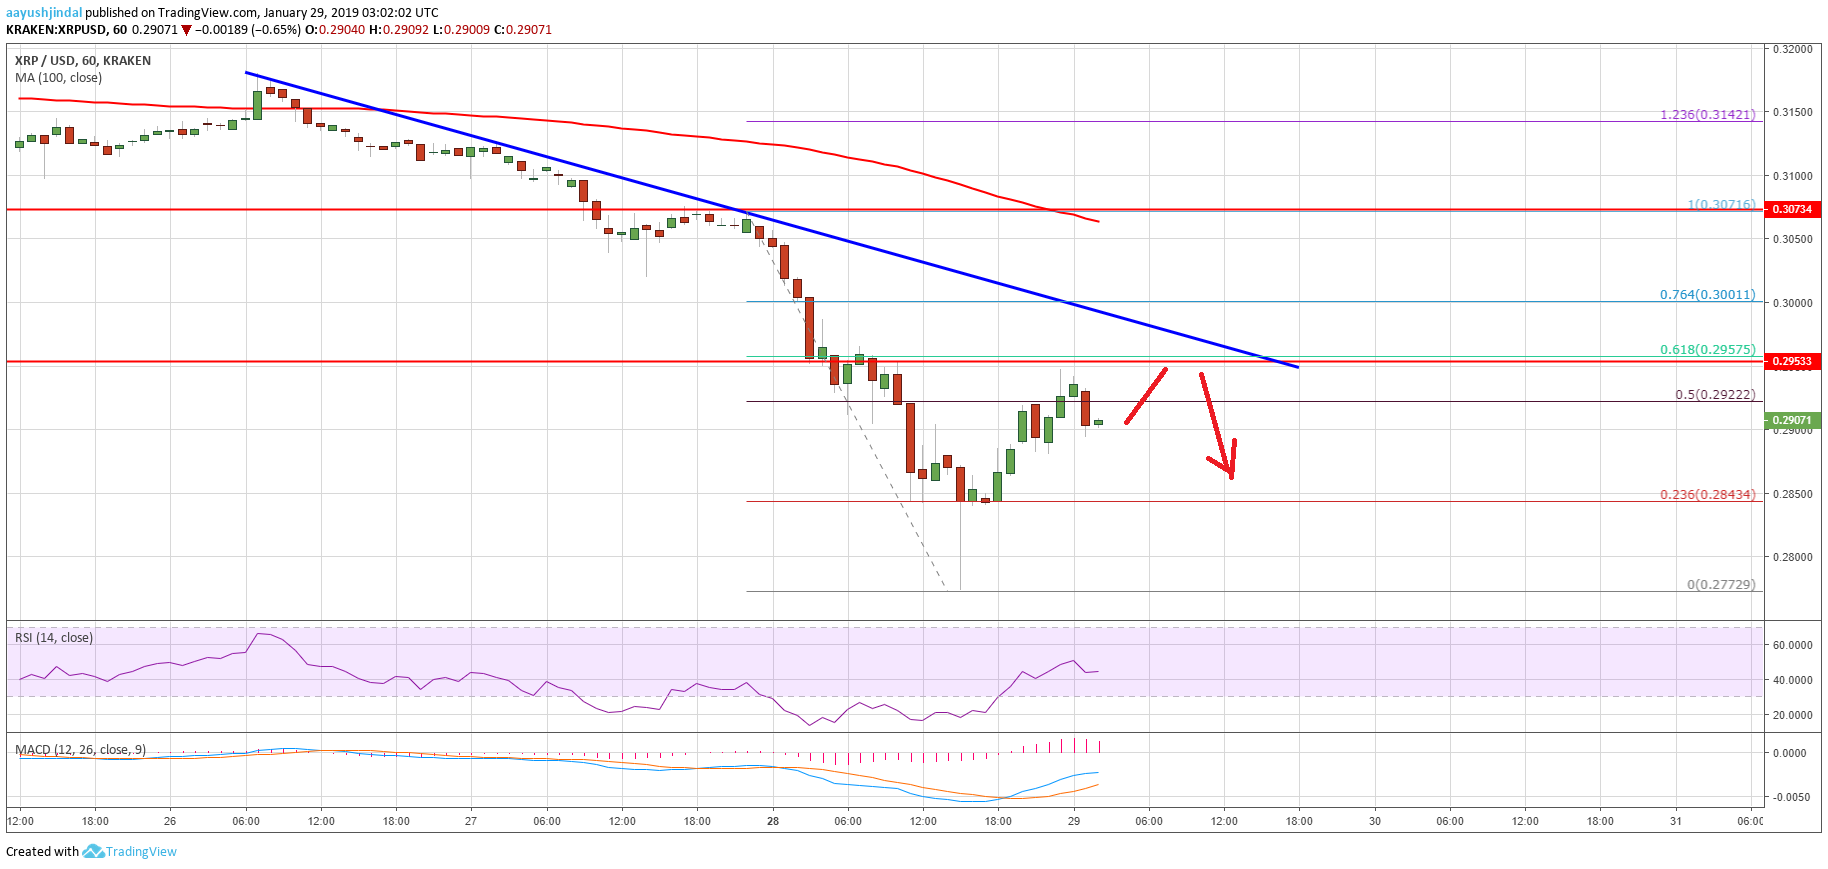
Looking at the chart, ripple price recovered nicely from the $0.2777 swing low. However, it is struggling to clear the previous key supports just below $0.3000. As long as the price is below $0.3000, there could be more losses.
Technical Indicators
Hourly MACD – The MACD for XRP/USD moved back in the bullish zone, but there are still many bearish signs.
Hourly RSI (Relative Strength Index) – The RSI for XRP/USD recovered and settled above the 45 level.
Major Support Level – $0.2840
Major Resistance Level – $0.2980


