
Reason to trust
How Our News is Made
Strict editorial policy that focuses on accuracy, relevance, and impartiality
Ad discliamer
Morbi pretium leo et nisl aliquam mollis. Quisque arcu lorem, ultricies quis pellentesque nec, ullamcorper eu odio.
- Ripple price topped near the $0.3820 level and later declined sharply below $0.3500 against the US dollar.
- There is a short term connecting bearish trend line formed with resistance at $0.3300 on the hourly chart of the XRP/USD pair (data source from Kraken).
- The pair is currently consolidating losses, but it may soon resume its decline below $0.3200 and $0.3100.
Ripple price made a sharp U-turn against the US Dollar and Bitcoin. XRP/USD is placed in a bearish zone and it may accelerate losses below the $0.3200 support.
Ripple Price Analysis
Recently, we saw an upside break above $0.3600 and $0.3700 in ripple price against the US Dollar. The XRP/USD pair even broke the $0.3800 resistance and traded as high as $0.3819. Later, there was a solid increase in selling interest, resulting in a significant decline below $0.3500. The price traded below the $0.3460 support and the $0.3300 pivot level. Moreover, there was a close below the $0.3350 level and the 100 hourly simple moving average.
A low was formed near $0.3165 and later the price corrected higher. It moved above the $0.3250 level, but upsides remain capped. An initial resistance is the 23.6% Fib retracement level of the recent decline from the $0.3819 high to $0.3165 low. Moreover, there is a short term connecting bearish trend line formed with resistance at $0.3300 on the hourly chart of the XRP/USD pair. If there is a break above the trend line and $0.3320, the price may recover further. The next major hurdle for buyers is seen near the $0.3480-0.3500 zone. It also represents the 50% Fib retracement level of the recent decline from the $0.3819 high to $0.3165 low.
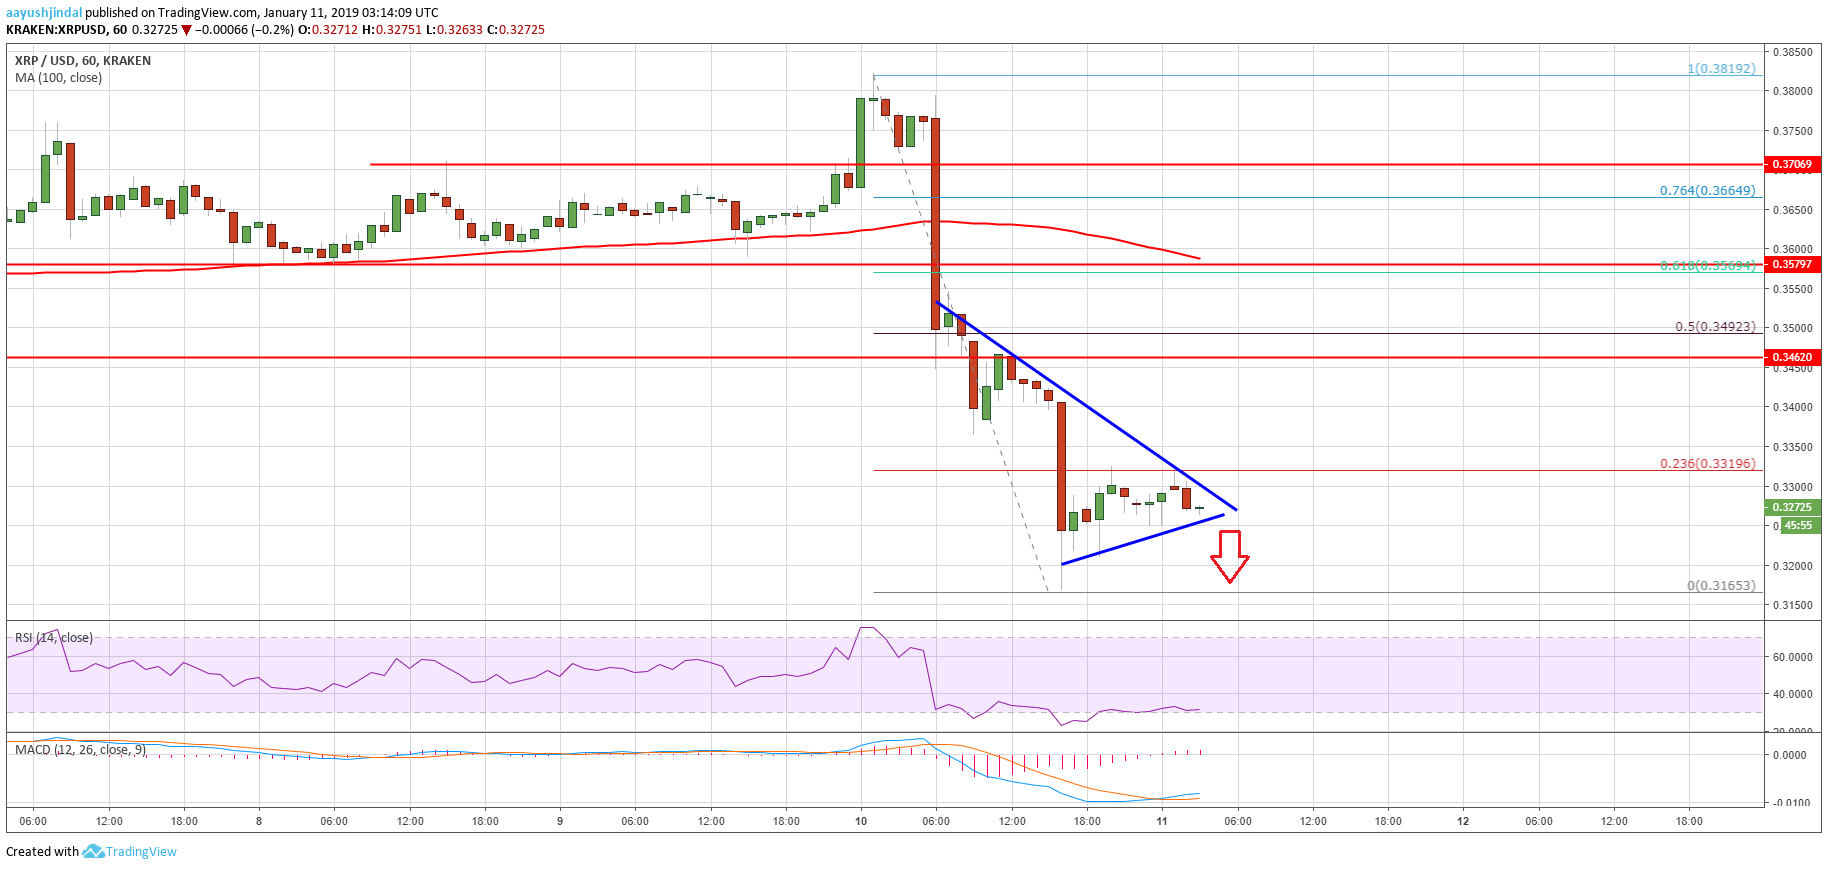
Looking at the chart, ripple price is clearly at a risk of more losses below $0.3200. Sellers are likely to push the price below the $0.3165 low as well. The next immediate support is at $0.3100 and $0.3050.
Technical Indicators
Hourly MACD – The MACD for XRP/USD is slightly placed in the bullish zone, but with a bearish angle.
Hourly RSI (Relative Strength Index) – The RSI for XRP/USD is currently well below the 40 level, with negative signs.
Major Support Level – $0.3200
Major Resistance Level – $0.3320


