
Reason to trust
How Our News is Made
Strict editorial policy that focuses on accuracy, relevance, and impartiality
Ad discliamer
Morbi pretium leo et nisl aliquam mollis. Quisque arcu lorem, ultricies quis pellentesque nec, ullamcorper eu odio.
Key Highlights
- Ripple price declined sharply, but the $0.4340 support acted as a solid support against the US dollar.
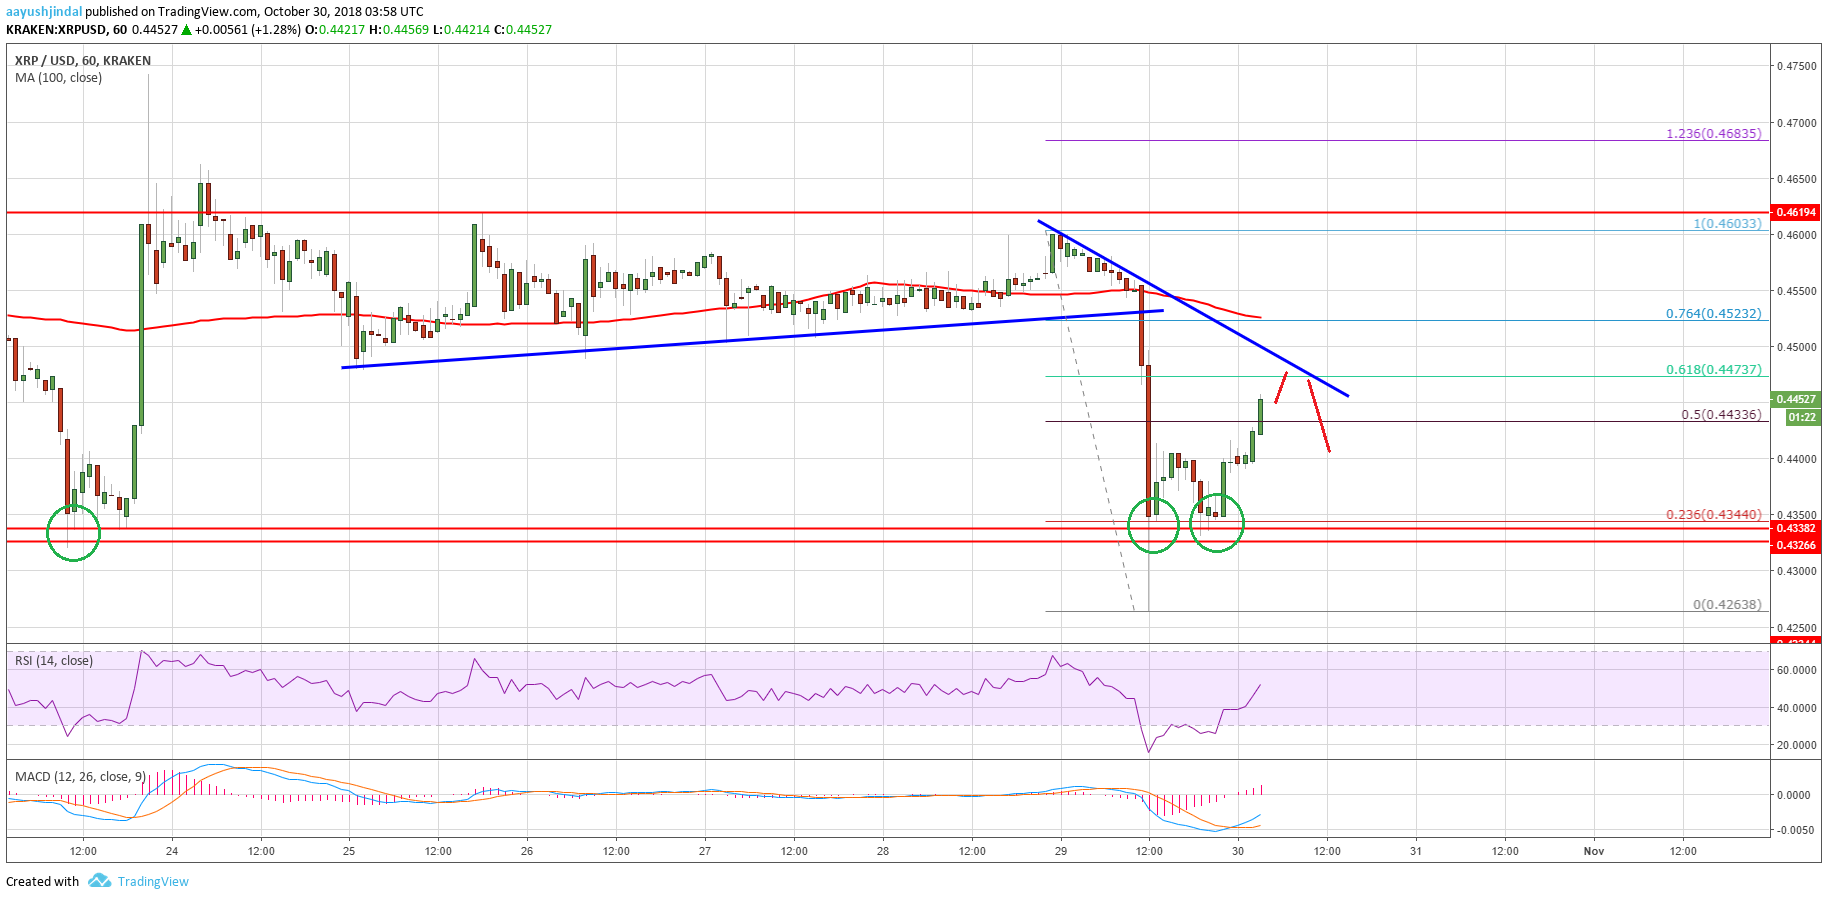
- There is a connecting bearish trend line formed with resistance at $0.4485 on the hourly chart of the XRP/USD pair (data source from Kraken).
- The pair could find sellers near the $0.4485 and $0.4500 levels, but dips remain supported.
Ripple price declined recently against the US Dollar and Bitcoin. However, XRP/USD found a strong buying interest near $0.4340 and recovered nicely.
Ripple Price Analysis
There was yet another rejection noted near the $0.4600 level in ripple price against the US Dollar. As a result, there was a sharp downside move in the XRP/USD pair below the $0.4500 support. The price surpassed a major bullish trend line with support at $0.4550 on the hourly chart. Moreover, there was a break below the $0.4480 level and the 100 hourly simple moving average.
The decline was such that there was a spike below the $0.4340 support area. However, the price recovered sharply and moved back above $0.4340 and $0.4400. The current price action is positive above the 50% Fib retracement level of the last decline from the $0.4603 high to $0.4263 low. On the upside, the price may face sellers near the $0.4500 level. There is also a connecting bearish trend line formed with resistance at $0.4485 on the hourly chart of the XRP/USD pair. Besides, the 61.8% Fib retracement level of the last decline from the $0.4603 high to $0.4263 low is at $0.4473. Therefore, the price may find a strong selling interest near $0.4480 and $0.4500.
Looking at the chart, ripple price is showing positive signs above $0.4400. If it declines once again, the $0.4340 support is likely to hold losses in the near term. To the topside, a break above $0.4500 is needed for an upside acceleration towards $0.4600.
Looking at the technical indicators:
Hourly MACD – The MACD for XRP/USD is back in the bullish zone.
Hourly RSI (Relative Strength Index) – The RSI for XRP/USD is back above the 50 level.
Major Support Level – $0.4340
Major Resistance Level – $0.4500


