
Reason to trust
How Our News is Made
Strict editorial policy that focuses on accuracy, relevance, and impartiality
Ad discliamer
Morbi pretium leo et nisl aliquam mollis. Quisque arcu lorem, ultricies quis pellentesque nec, ullamcorper eu odio.
Key Highlights
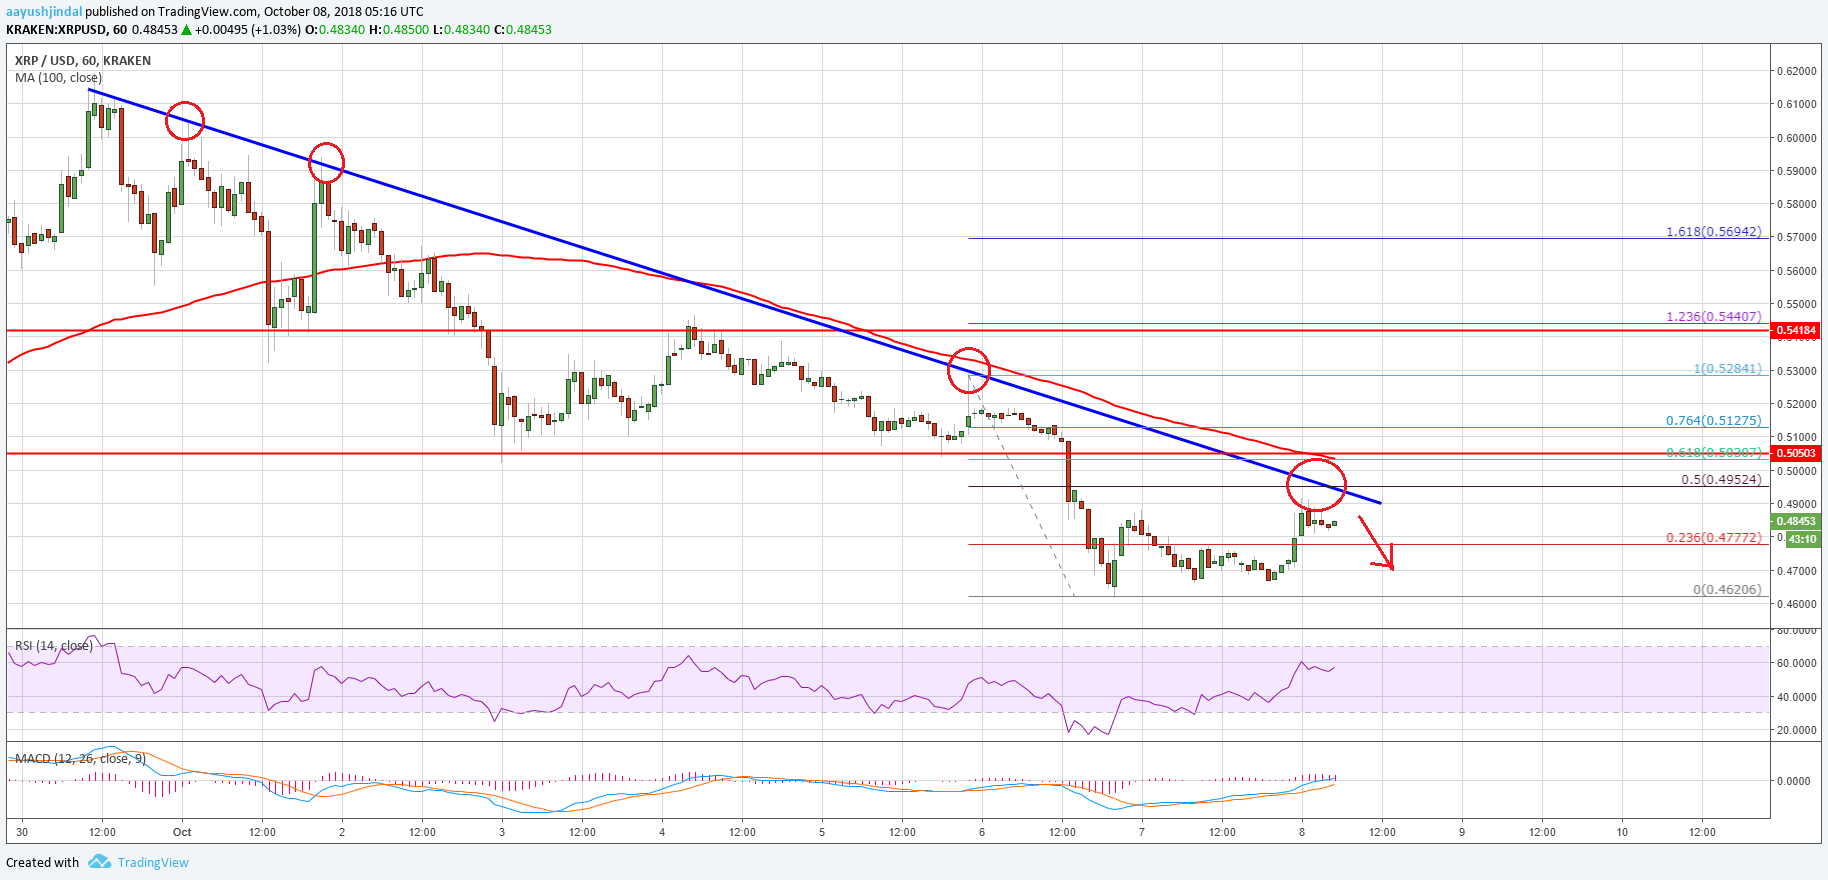
- Ripple price declined heavily and broke the $0.5200 and $0.5050 support levels against the US dollar.
- This is a major bearish trend line in place with resistance at $0.4950 on the hourly chart of the XRP/USD pair (data source from Kraken).
- The pair remains in a bearish zone as long as there is no close above $0.4950 and $0.5050.
Ripple price trimmed most of its gains against the US Dollar and Bitcoin. XRP/USD is likely to decline further unless buyers push the price above $0.5050.
Ripple Price Analysis
This past week, there was a steady downside initiated from the $0.5440 swing high in Ripple price against the US Dollar. The XRP/USD pair declined and broke a couple of important support levels like $0.5200 and $0.5050. The downside move was such that the price settled below $0.5000 and the 100 hourly simple moving average. It traded as low as $0.4620 and it is currently correcting higher.
The price has moved above the 23.6% Fib retracement level of the recent decline from the $0.5284 high to $0.4620 low. However, the price is approaching a crucial resistance area near $0.4950. More importantly, there is a major bearish trend line in place with resistance at $0.4950 on the hourly chart of the XRP/USD pair. The trend line is close to the 50% Fib retracement level of the recent decline from the $0.5284 high to $0.4620 low. Therefore, it won’t be easy for buyers to clear the $0.4950 resistance. Above this, the next major barrier awaits near $0.5050, which was a support earlier.
Looking at the chart, ripple price seems to be under a lot of pressure below $0.5050. If it fails to recover above $0.4950, there could be more losses towards $0.4600.
Looking at the technical indicators:
Hourly MACD – The MACD for XRP/USD is slowly moving in the bullish zone.
Hourly RSI (Relative Strength Index) – The RSI for XRP/USD is now back above the 50 level.
Major Support Level – $0.4620
Major Resistance Level – $0.4950


