
Reason to trust
How Our News is Made
Strict editorial policy that focuses on accuracy, relevance, and impartiality
Ad discliamer
Morbi pretium leo et nisl aliquam mollis. Quisque arcu lorem, ultricies quis pellentesque nec, ullamcorper eu odio.
Key Highlights
- Ripple price traded higher recently and broke the $0.4540 resistance against the US dollar.
- There was a break above a major contracting triangle with resistance at $0.4560 on the hourly chart of the XRP/USD pair (data source from Kraken).
- The pair is currently trading in a bullish zone above the $0.4540 and $0.4550 support levels.
Ripple price gained traction recently against the US Dollar and Bitcoin. XRP/USD may continue to trade higher as long as it is above $0.4540 and the 100 hourly SMA.
Ripple Price Analysis
After a downside correction from the $0.4740 high, ripple price found support near $0.4450 against the US Dollar. The XRP/USD pair traded as low as $0.4478 and later started a consolidating. A support base was formed near $0.4490 and later the price started an upward move. It traded above the $0.4500 level and the 100 hourly simple moving average. Besides, there was a break above the 23.6% Fib retracement level of the last decline from the $0.4741 high to $0.4487 low.
More importantly, there was a break above a major contracting triangle with resistance at $0.4560 on the hourly chart of the XRP/USD pair. It opened the doors for more gains and the price traded towards the $0.4600 level. However, the price faced sellers near $0.4600 and the 50% Fib retracement level of the last decline from the $0.4741 high to $0.4487 low. The price is currently correcting lower towards the previous resistance at $0.4540 and the 100 hourly SMA.
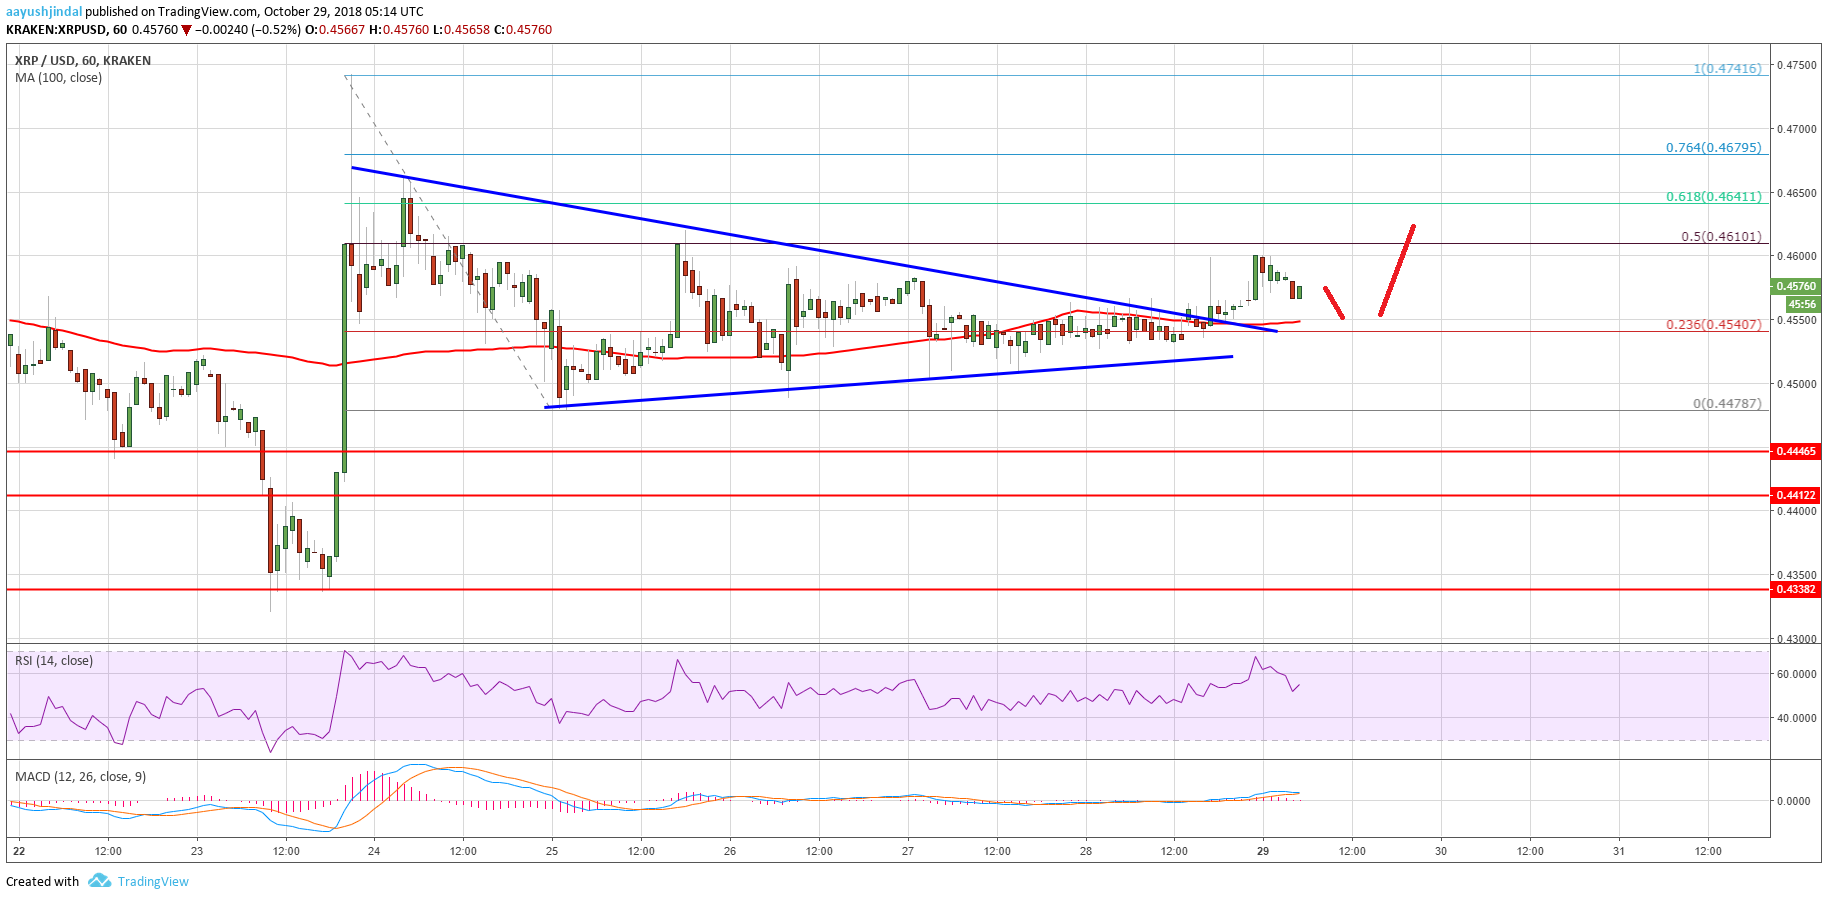
Looking at the chart, ripple price is trading in a positive zone above the $0.4540 and $0.4550 support levels. As long as the $0.4540 support is intact, there are chances of an upward move above the $0.4600 level in the near term.
Looking at the technical indicators:
Hourly MACD – The MACD for XRP/USD is slightly placed in the bullish zone.
Hourly RSI (Relative Strength Index) – The RSI for XRP/USD is currently placed above the 50 level.
Major Support Level – $0.4540
Major Resistance Level – $0.4600


