
Reason to trust
How Our News is Made
Strict editorial policy that focuses on accuracy, relevance, and impartiality
Ad discliamer
Morbi pretium leo et nisl aliquam mollis. Quisque arcu lorem, ultricies quis pellentesque nec, ullamcorper eu odio.
Key Highlights
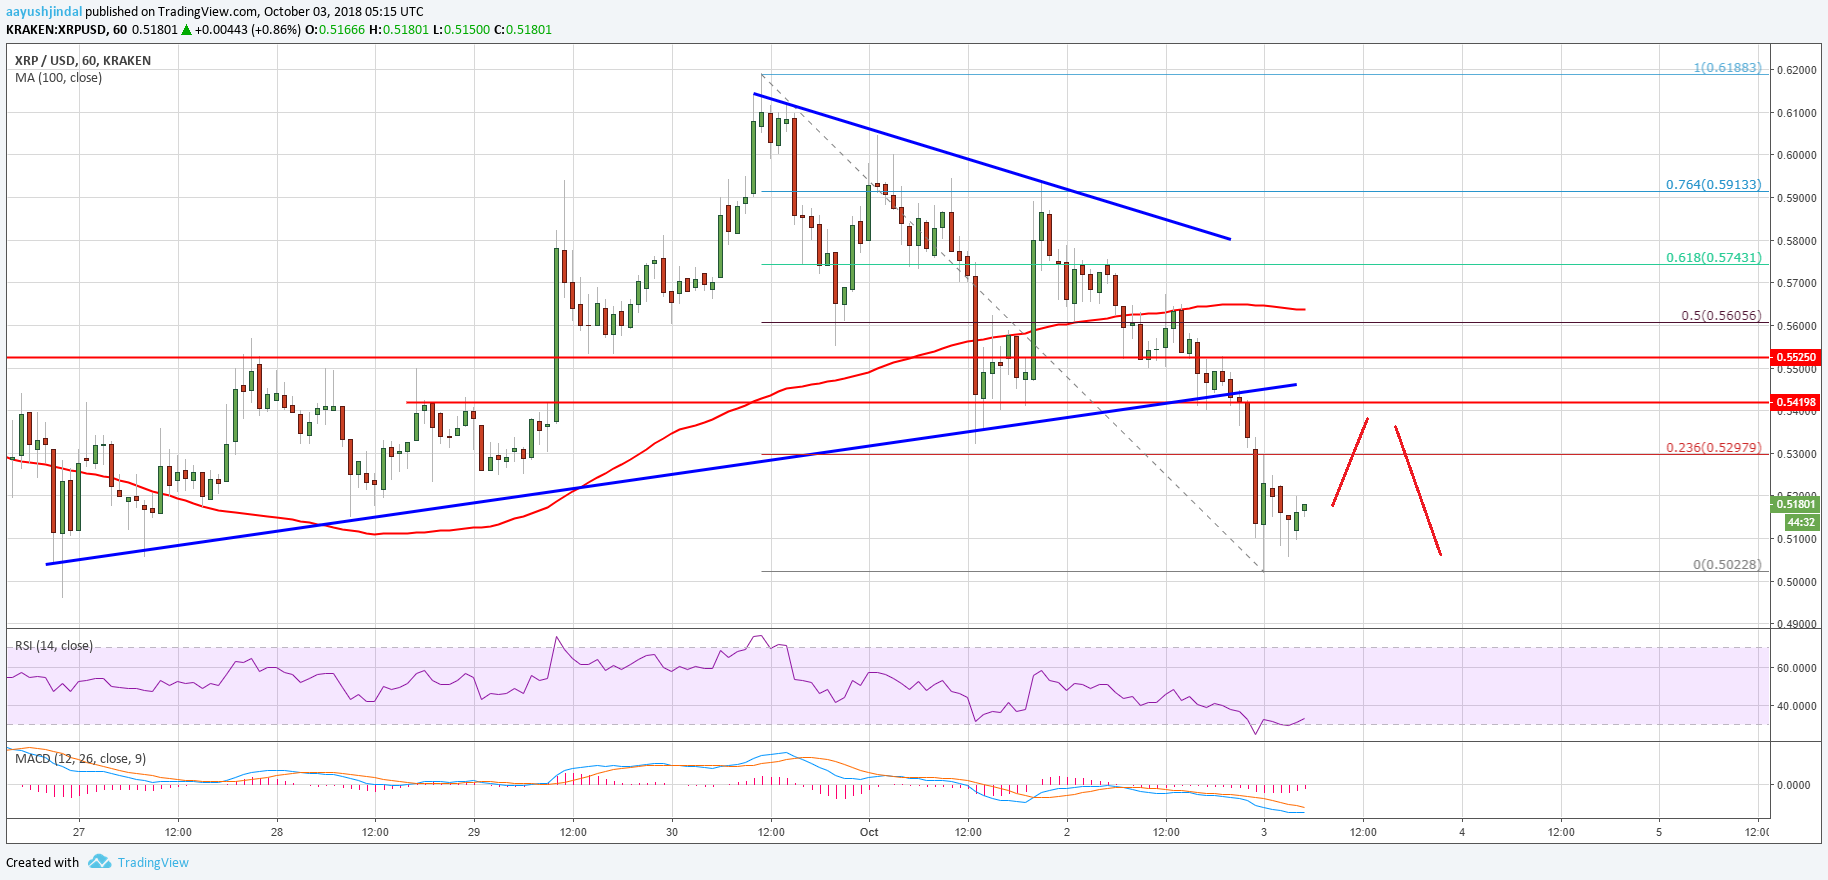
- Ripple price failed to hold the $0.5520 and $0.5500 support levels and declined sharply against the US dollar.
- There was a break below an important bullish trend line with support at $0.5420 on the hourly chart of the XRP/USD pair (data source from Kraken).
- The pair tested the $0.5000-0.5020 support and it is currently consolidating losses.
Ripple price is under bearish pressure against the US Dollar and Bitcoin. XRP/USD could correct higher, but the previous support at $0.5500 may now prevent gains.
Ripple Price Analysis
Yesterday, we discussed about a couple of important supports near the $0.5520 level for Ripple price against the US Dollar. The XRP/USD pair recently faced an increased selling pressure and broke the $0.5520 support. The decline was such that the price even broke the $0.5500 support and the 100 hourly simple moving average. Sellers even managed to clear the last major swing low at $0.5320.
More importantly, there was a break below an important bullish trend line with support at $0.5420 on the hourly chart of the XRP/USD pair. The pair surpassed the $0.5200 level and traded close to the $0.5000 support. A low was formed at $0.5022 and the price is currently consolidating losses. An initial resistance is the 23.6% fib retracement level of the recent drop from the $0.6190 swing high to $0.5022 low. However, it seems like the price may correct towards the $0.5500 level, which is likely to act as a resistance. Moreover, the 50% fib retracement level of the recent drop from the $0.6190 swing high to $0.5022 low is at $0.5600.
Looking at the chart, ripple price remains sell on rallies near the $0.5500 and $0.5600 levels. On the downside, if the price breaks the $0.5000 support, there could be more losses towards $0.4800.
Looking at the technical indicators:
Hourly MACD – The MACD for XRP/USD is now placed in the bearish zone.
Hourly RSI (Relative Strength Index) – The RSI for XRP/USD is well below the 40 level.
Major Support Level – $0.5000
Major Resistance Level – $0.5300


