
Reason to trust
How Our News is Made
Strict editorial policy that focuses on accuracy, relevance, and impartiality
Ad discliamer
Morbi pretium leo et nisl aliquam mollis. Quisque arcu lorem, ultricies quis pellentesque nec, ullamcorper eu odio.
Key Highlights
- Ripple price declined recently and tested the $0.5000 support area against the US dollar.
- There is a major bearish trend line in place with resistance at $0.5120 on the hourly chart of the XRP/USD pair (data source from Kraken).
- The pair is currently under pressure below the $0.5120 and $0.5200 resistance levels.
Ripple price is struggling to gain bullish momentum against the US Dollar and Bitcoin. XRP/USD may continue to consolidate below $0.5200 for the next few sessions.
Ripple Price Analysis
After testing the $0.5200 resistance, ripple price declined once more against the US Dollar. The XRP/USD pair formed a swing high at $0.5255 and traded below the $0.5150 level. There was even a close below the $0.5100 level and the 100 hourly simple moving average. The decline was such that the price spiked below the $0.5000 support. However, the price recovered later and it is currently consolidating above $0.5000.
An initial resistance is the 23.6% Fib retracement level of the recent slide from the $0.5255 high to $0.4970 swing low. There is also a major bearish trend line in place with resistance at $0.5120 on the hourly chart of the XRP/USD pair. Around the trend line, the 50% Fib retracement level of the recent slide from the $0.5255 high to $0.4970 swing low is positioned at $0.5114. Therefore, if the pair corrects higher, it could find a strong resistance near $0.5115 and $0.5120. Above the trend line, the next major hurdle for buyers is near the $0.5200 level. On the downside, an initial support is at $0.4970, below which the price could revisit $0.4860.
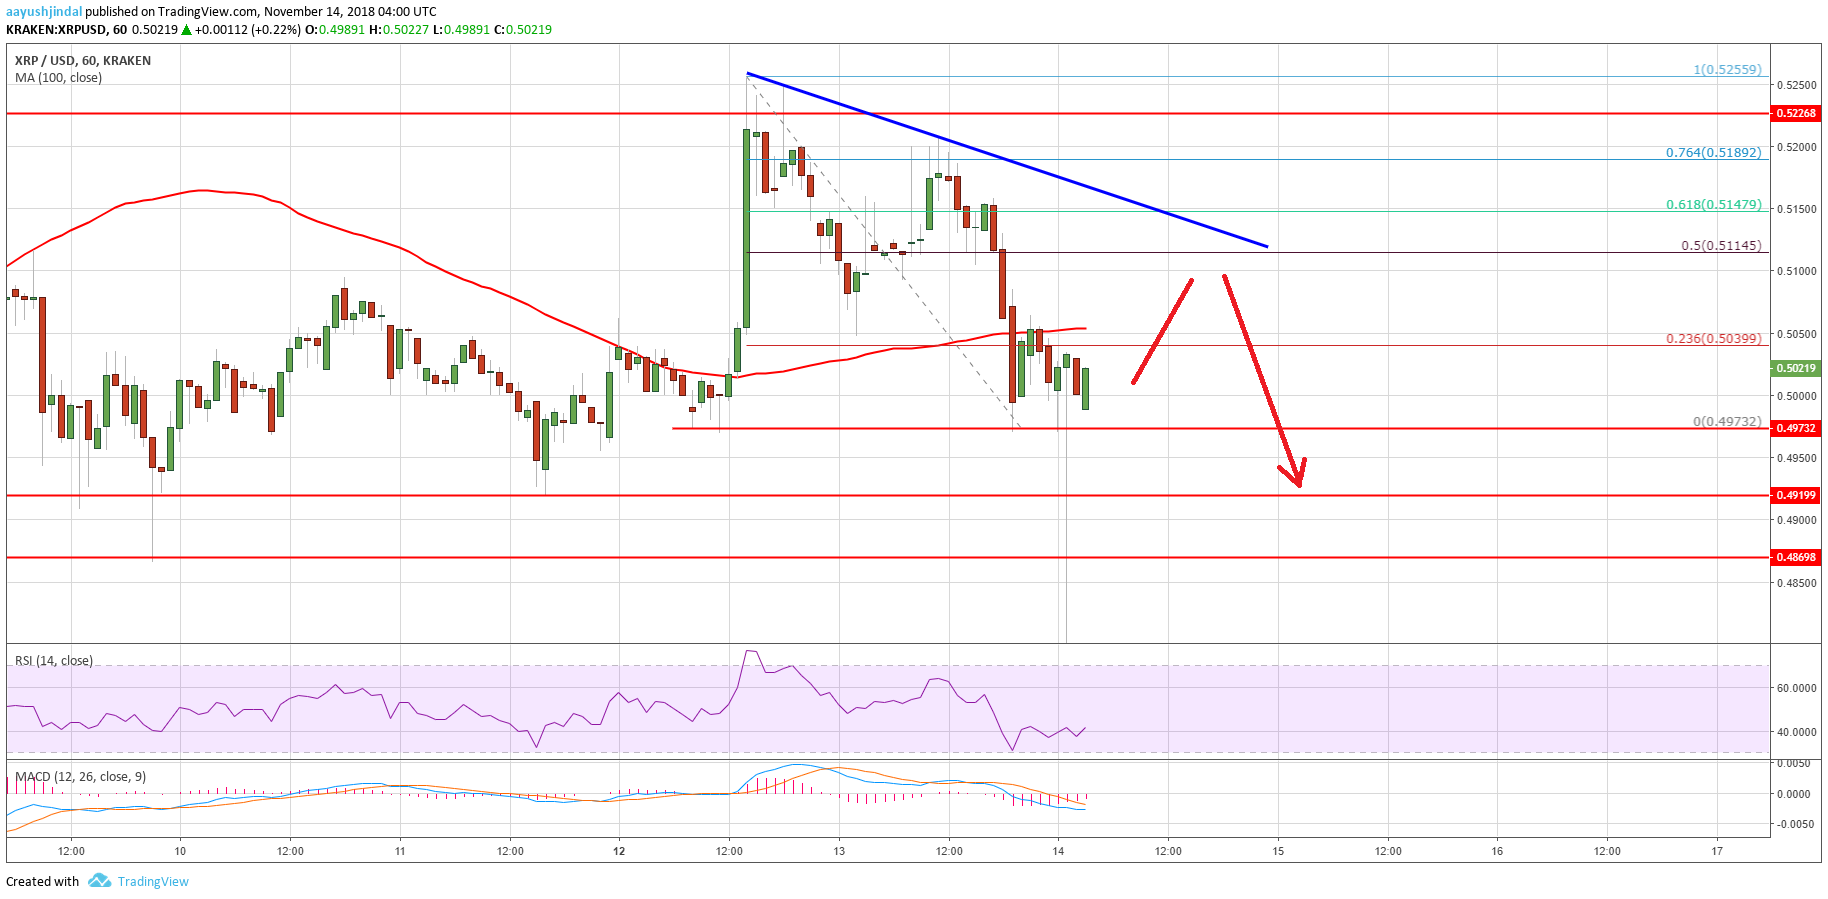
Looking at the chart, ripple price is clearly under pressure below the $0.5200 resistance area. If buyers continue to fail to gain traction, the price may perhaps decline towards $0.4860 or $0.4700.
Looking at the technical indicators:
Hourly MACD – The MACD for XRP/USD is placed in the bearish zone.
Hourly RSI (Relative Strength Index) – The RSI for XRP/USD is well below the 50 level.
Major Support Level – $0.4970
Major Resistance Level – $0.5200


