
Reason to trust
How Our News is Made
Strict editorial policy that focuses on accuracy, relevance, and impartiality
Ad discliamer
Morbi pretium leo et nisl aliquam mollis. Quisque arcu lorem, ultricies quis pellentesque nec, ullamcorper eu odio.
Key Highlights
- Ripple price is currently trading below the $0.4615 and $0.4660 resistance levels against the US dollar.
- There was a break below a contracting triangle pattern with support at $0.4550 on the hourly chart of the XRP/USD pair (data source from Kraken).
- The pair may correct a few points lower, but it could find support near the $0.4400 and $0.4230 levels.
Ripple price is consolidating above key supports against the US Dollar and Bitcoin. XRP/USD must break the $0.4615 and $0.4660 resistances to climb higher.
Ripple Price Analysis
After Ripple price failed near the $0.4750 resistance, there was a downside correction against the US Dollar. The XRP/USD pair declined and tested the $0.4400 support area. A low was formed at $0.4399 before the price started an upside move. It recovered above the $0.4500 level and the 100 hourly simple moving average. There was also a break above the 23.6% Fib retracement level of the recent decline from the $0.4748 high to $0.4399 low.
However, the price struggled to break the $0.4600 and $0.4615 resistance levels. Moreover, there was no close above the 50% Fib retracement level of the recent decline from the $0.4748 high to $0.4399 low. As a result, there was a downside reaction below the $0.4550 level. There was also a break below a contracting triangle pattern with support at $0.4550 on the hourly chart of the XRP/USD pair. At the outset, the pair seems to be struggling to break the triangle resistance trend line, which is currently at $0.4580. Therefore, there could be a fresh decline towards the $0.4400 or $0.4300 level before the price bounces back.
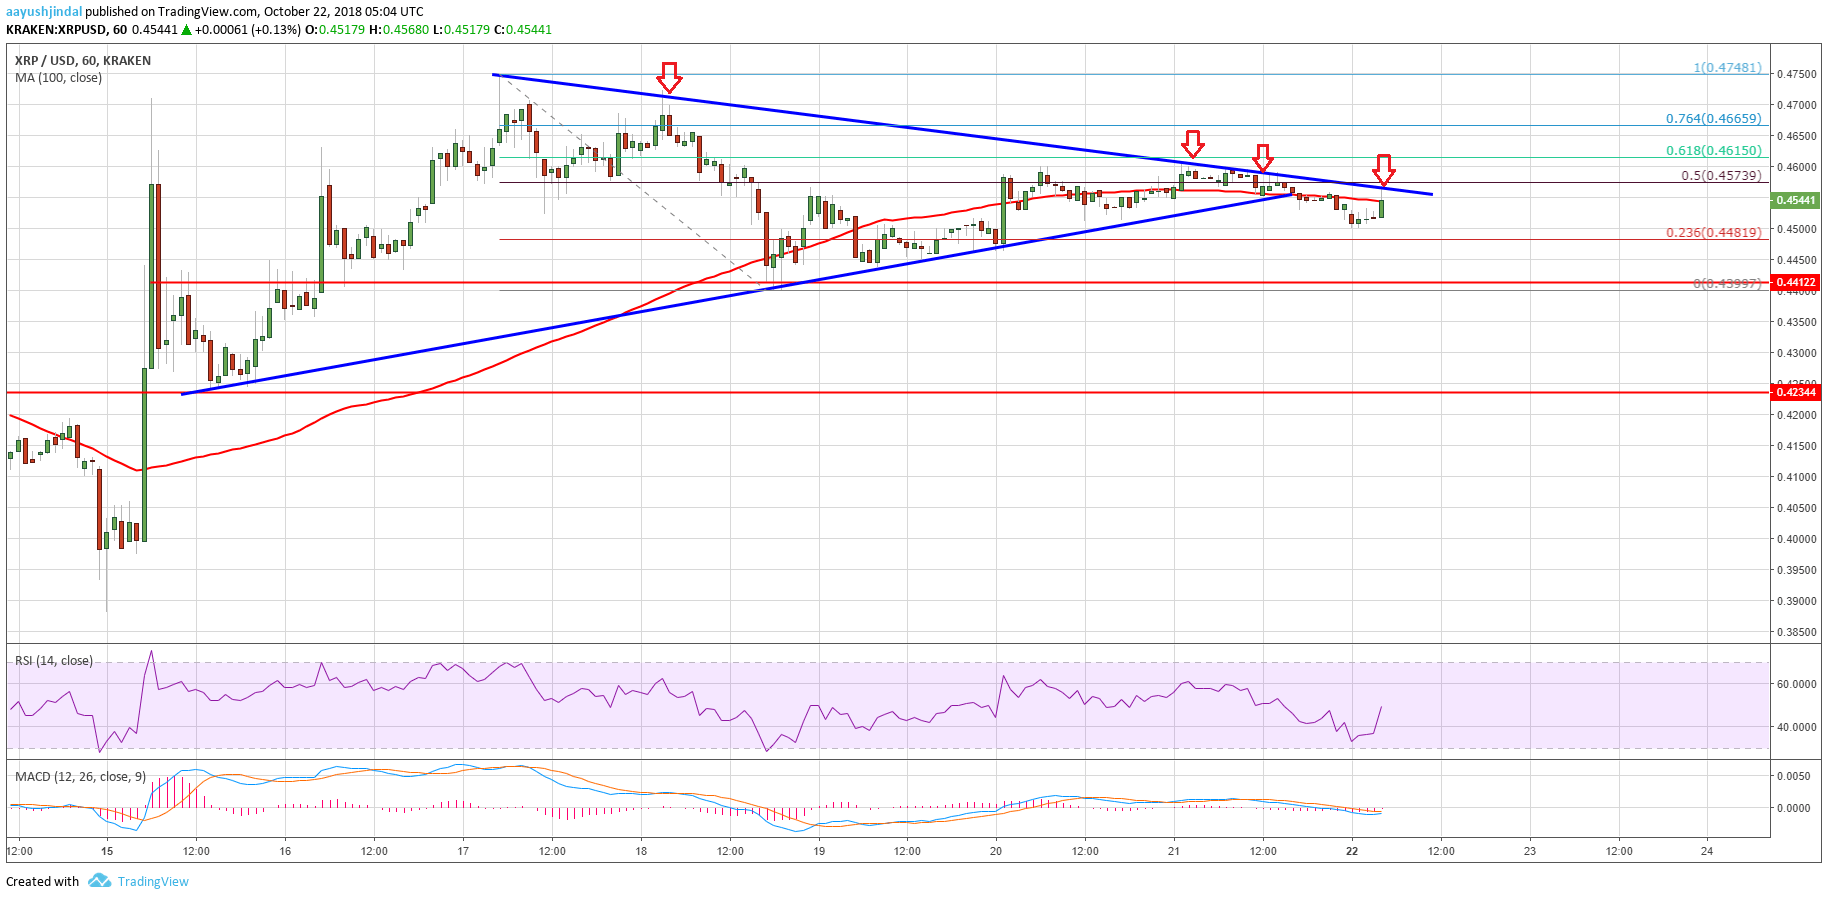
Looking at the chart, ripple price must break the $0.4615 and $0.4660 resistance levels to trade to a new high above the $0.4748 level.
Looking at the technical indicators:
Hourly MACD – The MACD for XRP/USD is slowly moving in the bullish zone.
Hourly RSI (Relative Strength Index) – The RSI for XRP/USD is just above the 50 level.
Major Support Level – $0.4400
Major Resistance Level – $0.4660


